


Gyrating Gold abounds! Through the completion of May’s 20 trading days, Gold (per its August contract) has chronologically gone up to 4708, down to 4546, up to 4810, down to 4681, up to 4769, down to 4488, up to 4616, down to 4396, price nonetheless getting the month-end bid in settling up yesterday (Friday) at 4570. Gold’s gyrating high-to-low run for the month was -8.8% … but the net change was a comparably wee -2.1%, (Gold having closed the month of April at 4669).
Either way, that’s a “Whole Lotta Shakin’ Goin’ On”–[Jerry Lee Lewis, ’57] only to result in “Goin’ Nowhere”–[Chris Isaak, ’95].
However, there’s been this one anti-conventional wisdom constant throughout. On those days wherein ’twas inferred the Middle-East “war shall continue”, Gold would go down; on the alternate days wherein ’twas said a “peace deal was close”, Gold would go up. (And we’ve herein documented ad nauseam how Gold — after initially spiking — then directionally defies geo-political conventional wisdom).
‘Course, on those “war shall continue” days, Oil and the Dollar would get the bid to the detriment of Gold, but vice-versa if “a peace deal was close”. And as noted, such assessment continues to revolve 180° from one day to the next as if ’twere a modern-day rewrite of Leo Tolstoy’s “War and Peace”, –[circa 1865].
“Or even Shakespeare’s ‘Much Ado About Nothing’, huh mmb?”
Well, we wouldn’t go so far as to say war is “nothing”, Squire, but The Bard’s title –[circa 1598] is apropos of Gold’s gyrational travel throughout May, although price’s regression trend has therein been negative, (as surprisingly too has been that for Oil, even as its peaks and troughs have been pointedly opposed to those for Gold).
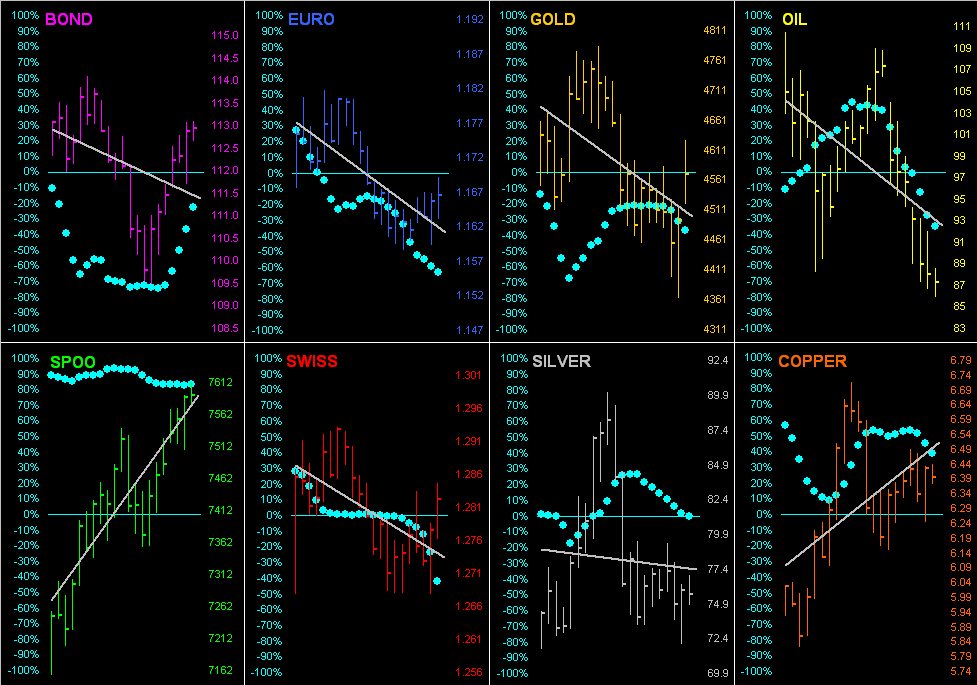
So, it being month-end, let’s go ’round the horn for all eight BEGOS Markets across their last 21 trading days (one month), featuring their respective grey diagonal trendlines and “Baby Blues” which are the dots that depict the day-to-day consistency of trend. Note the S&P 500 (“SPOO”) sporting the steepest uptrend of the set:
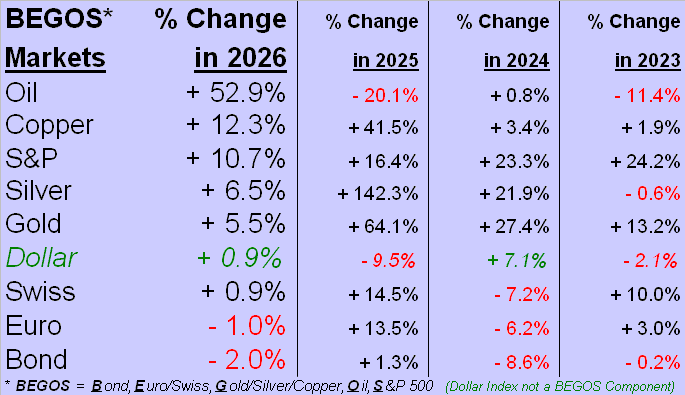
As for the year-to-date BEGOS Markets Standings, this end of May marks the first month of 2026 wherein both Gold and Silver are not amongst the top three podium positions. “Big Oil!” continues to overwhelm the pack; but now Copper and the wildly overvalued S&P 500 rank second and third respectively. And note this anomaly therein: both the Dollar Index and Swiss Franc are up like amounts. “At the expense of which currency”, you ask? See the €uro, (as well as the not-listed ¥en):
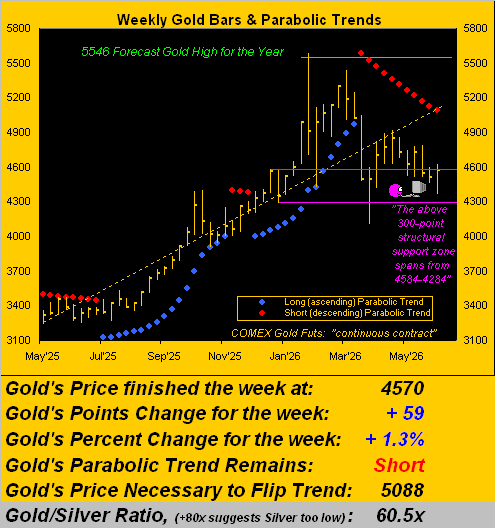
Specific to Gold, it has just completed an eleventh week of the ongoing parabolic Short trend, below depicted by the rightmost red dots in our chart of weekly bars from a year ago-to-date. For those of you scoring at home, Gold’s expected daily trading range is now 104 points, whereas the weekly is 304 points. Thus per the foot of the graphic — the price to flip the trend to Long being 5088 — such 518-point distance is quite out-of-range for at least the ensuing week. As veteran charter reader THR would quip: “Gold will make you old.” ‘Course, let us not overlook that century-to-date, (which for you WestPalmBeachers down there began on 01 January 2001), whereas the S&P 500 (ex-dividend) is +474%, Gold has outperformed it by better than three times, our precious metal being +1,570%. “Got Gold?”
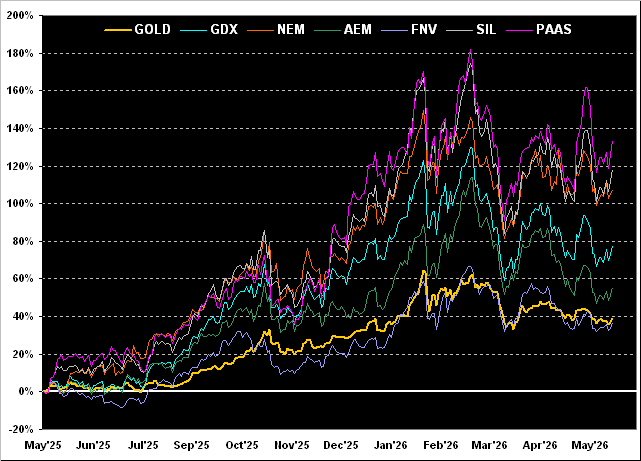
Bringing on our month-end metals’ equities view, year-over-year they accrue with Franco-Nevada (FNV) +37%, Gold itself +39%, Agnico Eagle Mines (AEM) +55%, the VanEck Vectors Gold Miners exchange-traded fund (GDX) +78%, Newmont (NEM) +108%, Global X Silver Miners exchange-traded fund (SIL) +118%, and Pan American Silver (PAAS) +134%. The downward trends from mid-winter technically remain in force, but resilient buying efforts clearly occur in the mix:
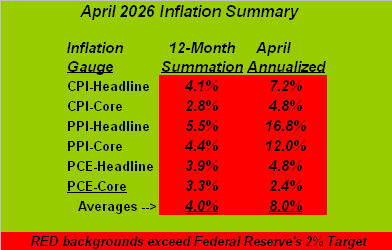
Next we query: “How’s that StateSide inflation workin’ out for ya?” Rather irksome, what? Oh to be sure, last Thursday’s release of “core” Personal Consumption Expenditures for April was sufficiently “Fed-friendly” such that you know, and we know, and everyone from Bangor, Maine to Honolulu knows the Federal Reserve’s Open Market Committee shall (with relief) stand pat rather than raise the Bank’s Funds rate per the pending 17 June Policy Statement. But unless inflation truly is cooling, ’tis merely a matter of meetings until FOMC’s hand is forced to raise, (barring economic descent into a deflationary recession). Here is our completed 12-month inflation summary through April. Mind the red backgrounds in noting that the summation average for these gauges of inflation is double the Fed’s desired +2% pace, and April’s annualized average is quadruple same. Yet, you can ease your strain of that irksome inflation pain merely by neither driving nor eating. Have a great day:
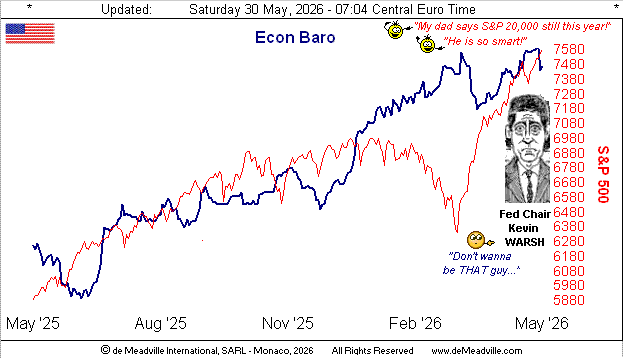
But hardly was it a great week for the Economic Barometer. Of this last week’s ten incoming metrics, just two improved period over period, the best being April’s Durable Orders that leaped +7.9% — an 11-month best — which clearly beat consensus, the March increase also being revised upward. The notable poor performers were both Personal Income and New Home Sales for April, along with Initial Jobless Claims rising to the fourth-worst level through the 21 reported weeks year-to-date. Elicited within the overall mix is that folks spent more during April than they earned. The Tax Man? Inflation? Thank goodness for the cortesone of the credit card! Here’s the Baro, featuring mindless goofballs at the top, plus the fresh FedHead:
“And what about you saying that the S&P is ‘wildly overvalued’, mmb?”
That’s one of Squire’s classic tee-up softball questions, indeed notably timely in this case given the fat round price/earnings ratio. Here you are, my fine friend:
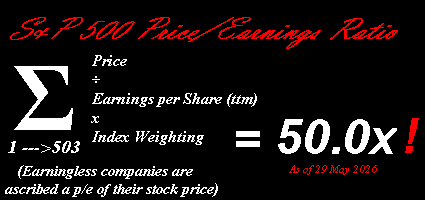
But into feeding “AI” (“Assembled Inaccuracy”) that precise formula, this time the response (and ’tis always different) is that it “…cannot be computed without a private premium database feed…”, in lieu then offering the Wall Street Journal’s calculation of 25.7x. (Clearly, they’ve no idea what’s coming). Again cue Kansas Joe & Memphis Minnie:  “When the Levee Breaks”
 –[’29], (yes really, the “crash” year).
Coming here are the 10-day Market Profiles for Gold on the left and for Silver on the right. Recall a week ago the large pricing Profile gaps for both precious metals, each having since fallen beneath those respective zones. Today, both the yellow and white metals are trading within their most volume-dominant price areas of the past two weeks:

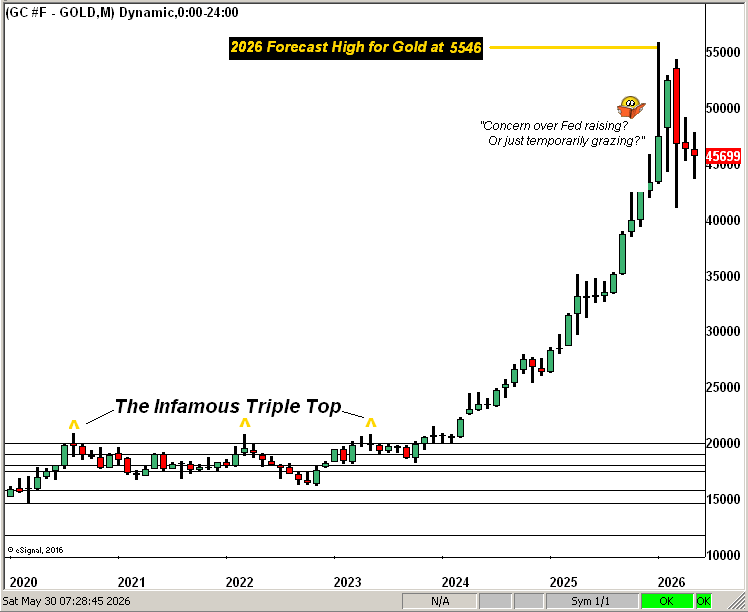
Toward wrapping up May we next go to Gold’s Structure by the month across the past 12 years. Following an stint of eight consecutive up months (from last July through February), price has now completed three straight down months per the rightmost red candles. Gold has not recorded a fourth consecutive down month since a string of seven of them in the midst of Fed rate hikes through mid-2022. As aforementioned, this next FOMC 17 June go-round shan’t see them raise … but then a lot can happen from then to 29 July (i.e. the subsequent FOMC meeting). Still, for the nth time we remind you that from 2004 through 2006 — during which period the Fed was tightening — Gold rose in stride just fine, thank you very much. Here are the monthlies:
Thus we’ve Golden gyrations and irksome inflation. Might better guidance be obtained from next week’s batch of thirteen incoming Econ Baro metrics, which include a purported slowing in StateSide Payrolls for May? And what about that S&P 500 price/earnings ratio now at a full 50.0x? The Index is now 36 consecutive trading days “textbook overbought”, indeed “extremely” so per Friday’s record high (7599). Regardless…

Hang on to your Gold!
Cheers!
…m…
www.TheGoldUpdate.com
www.deMeadville.com
and now on “X”: @deMeadvillePro
deMeadville. Copyright Ⓒ 2010 – 2026. All Rights Reserved.
Read the full article here