


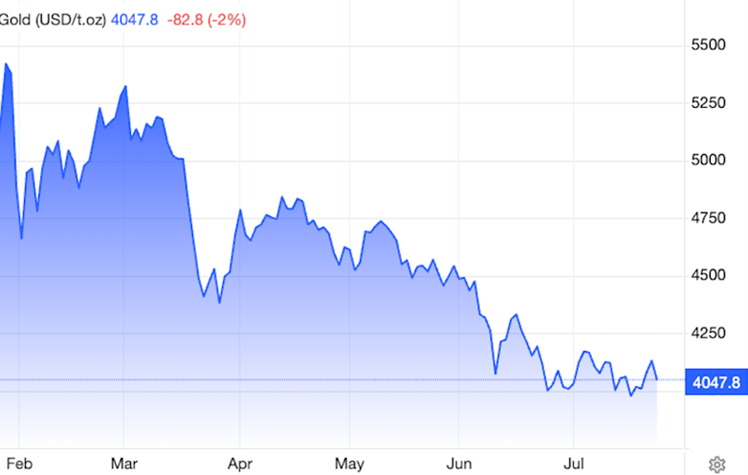
Whatever the reasons, gold shone brightly for a while. It blasted through US$3,000 an ounce in March 2025, then US$4,000 in October, then US$5,000 in January 2026, when it surged to an intraday high of US$5,626.80 an ounce.
Suddenly, it looked like everyone was a gold bug. Analysts at Deutsche Bank and JPMorgan Chase & Co., among others, expected gold to break through US$6,000 an ounce next as the party rocked on.
Instead, the rally has faded in a big way, suggesting that the price of gold behaved like an over-popular stock that felt the pull of gravity.
The price has fallen more than US$1,600 from its highs near the start of the year. At a level just below US$4,000 an ounce early Friday, gold is now trading at nine-month lows.
By the looks of it, investors have moved on.
This July 17 op-ed in the Globe and Mail newspaper is typical of mainstream media’s view of gold. Because it offers neither interest nor a dividend — so-called “green shoots” — gold is often downplayed as an investment. Only good for emergencies, as insurance against the unthinkable, such as a currency collapse. Or as the author of the above column puts it, “its traditional role as a hedge against calamity, where it belongs.”
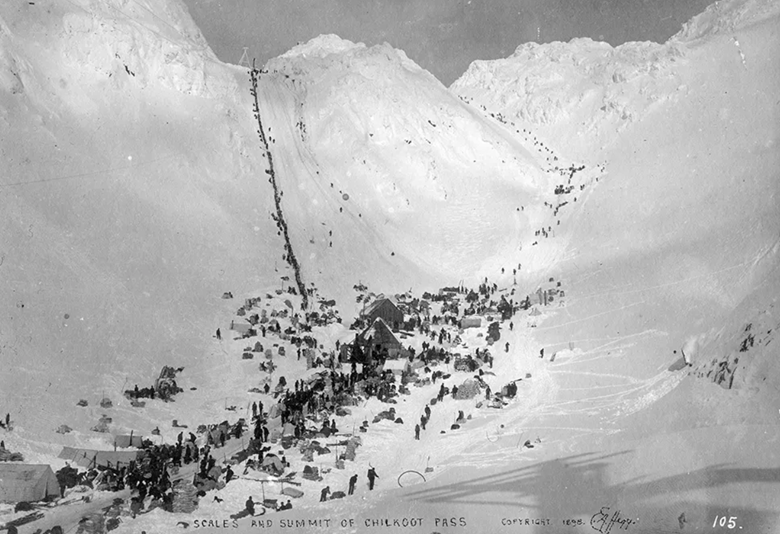 Traffic over Golden Scale Chilkoot Pass
Some people disregard the idea of owning gold or returning to the “barbarous relic”, as economist John Maynard Keynes referred to the gold standard in his 1924 book on monetary reform, suggesting gold had outlived its usefulness.
Let’s start with some facts. Gold has indeed fallen sharply from its January 2026 all-time high of $5,626. As of this writing, the precious metal is trading at $4,045. That’s a loss of $1,581, or 28%, in six months, give or take.
 Source: Trading Economics
Gold prices are falling due to the stronger US dollar, expectations that the Federal Reserve will raise interest rates, and liquidations as investors pivot toward higher-yielding assets. Key reasons for the decline from January’s record high include:
- Hawkish Interest Rate Expectations: Surging oil prices have reignited inflation fears. Markets are pricing in a high probability of Fed rate hikes to combat these pressures. Higher interest rates increase the appeal of cash and bonds, hurting non-yielding assets like gold.
- A Stronger US Dollar: Gold is priced in US dollars. Recent economic data and a hawkish tone from the Fed have strengthened the dollar, making gold more expensive for international buyers.
- Liquidity and Profit-Taking: Following a record-setting run that pushed gold above US$5,500 per ounce earlier in the year, many investors took profits. Additionally, there has been market speculation that some central banks in the Middle East sold off gold reserves during the Iran conflict to raise cash.
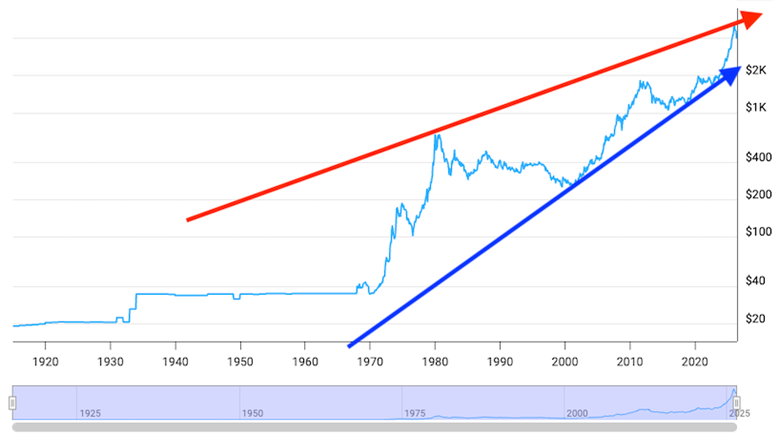
But here’s the thing. Gold has been rising and falling for the last 50 years but mostly rising. A historical gold chart shows the gold price stuck on $35 an ounce while the United States’ monetary policy was to peg the US dollar to gold. In 1971, when President Nixon removed the peg, thus ending the gold standard, gold started climbing from about $40 to about $662 in mid-1980. From there gold traded sideways for many years, but gradually it fell, to $259 in March 2001.
Gold then went on a tear for 11 years, hitting 1,728 in November 2012 before pulling back. By November 2015 it was trading at just $1,065. This bear market for gold shook out a lot of investors but the metal wasn’t done yet. From $1,065 gold climbed to $1,971 in July 2020, dipped to $1,623 in October 2022, before ascending to its most recent peak of $5,626 at the end of January 2026.
The big picture shows gold starting at $35 in 1971 and making a stepped ascent to $5,626 in 25 years, for a 160X gain or +$15,900%!
Every time gold has climbed up a step it has hit a new high and each time it hit a low, the low was higher than the previous low. Remarkably, gold has never, in 50 years, crashed through a previous low. Every high has been higher than the last and every low has been higher than the last.
 Source: Macrotrends/ AOTH
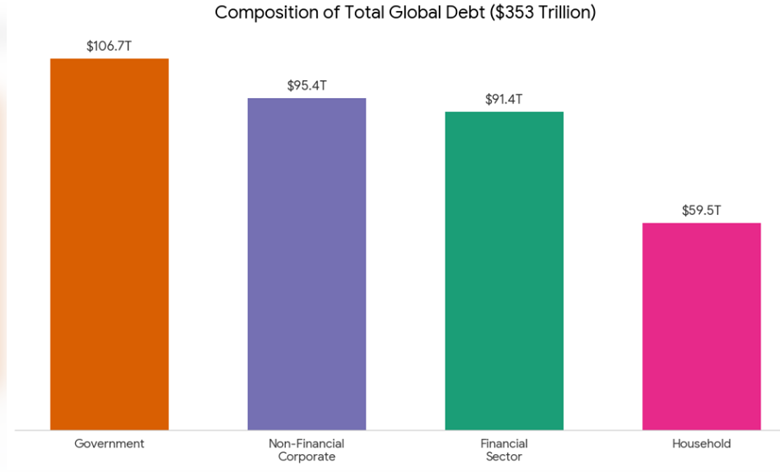
At the same time debt has expanded massively since President Nixon transitioning the world into a purely fiat monetary system. Without a hard asset constraint like gold limiting money creation, total global debt has surged to near $353 trillion, with government debt in developed economies alone climbing toward a record $75.8 trillion.
We can potentially see whether gold has hit its bottom by calculating the average drop from high to low over the past 50 years and applying it to the present scenario. Doing that we find:
November 1975 high of $171 to September 1976 low of $116 = 47%
November 2012 high of $1,728 to November 2015 low of $1,065 = 62%
July 2020 high of $1,971 to October 2022 low of 1,623 = 21%
January 2026 high of $5,626 to current 4,045 = 28%
The average percentage drop from high to low across these four periods is 39.5%
Going from $5,626 down to $3,963 is a 28% drop.
A fragile ceasefire collapsed between the US and Iran; since July the war is back on. US casualties are starting to mount. ABC News reports scores of American troops have been injured and at least four service members have been killed in escalated attacks in the Middle East.
The recent deaths and injuries over the weekend bring the toll to at least 18 U.S. service members who have been killed since the U.S. and Israel launched strikes against Iran on Feb. 28, and roughly 500 have been wounded, according to Defense Department figures, including an updated casualty count provided Monday by Pentagon spokesman Sean Parnell.
On Thursday Trump threatened a “massive attack” against Iran on a scale larger than previous strikes. This followed an earlier threat of “major military punishment” against Iran and the Houthis, after the Iran-backed Yemeni militia attacked two Saudi Arabian oil tankers in the Red Sea. (The Guardian).
The Houthis earlier this week closed the Strait of Bab el-Mandeb, a strategic waterway at the entrance to the Red Sea through which about 12% of global commerce flows.
The Strait of Hormuz remains effectively closed.
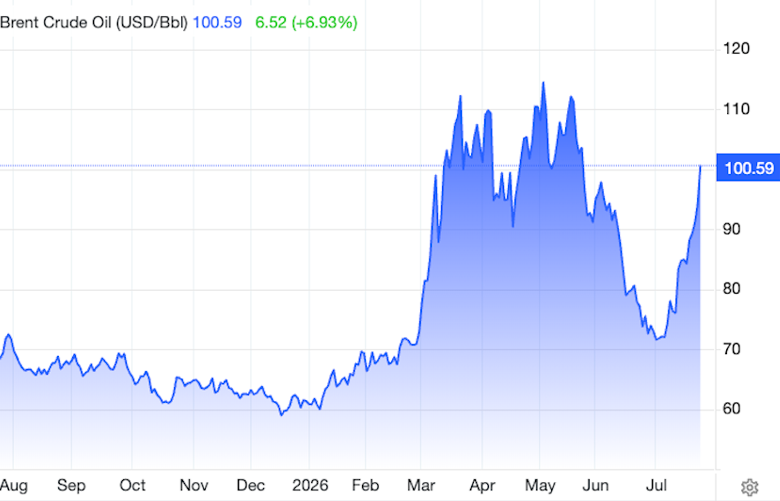
Crude oil again crossed the $100 threshold Thursday, leading to fresh inflation concerns and reviving talk of US interest rate hikes needed to cool the overheating economy.
Earlier we wrote about “economic price shocks” being the driving force behind the current inflation. Our underlying thinking was that if the war was close to ending inflation would go back to where it was before the war and heading lower.
Monetary inflation vs ‘economic shock’ price increases — Richard Mills
(Remember, new Fed Chair Kevin Warsh is a monetarist. He believes excessive money-printing to be the cause of inflation and prefers to measure price increases using “trimmed averages” which strip out outlier price increases or price decreases. That includes oil price shocks.)
Now, with the war in the Middle East ramping up, how long will it be before this turns from an inflation/ rising interest rates/ strong dollar/ narrative into a war narrative? A war narrative, while obviously bad for all concerned, would be good for gold because the metal would attract safe-haven demand. But if oil prices remain high, inflation would have more time to rip through the global economy and result in interest rate hikes by central banks. That would be bad for gold, which usually moves in the opposite direction of the US dollar and interest rate increases.
(Or would it? Read the surprising answer in the Conclusion.)
Key to answering the war narrative question is the global bond market, estimated to be worth roughly $140 trillion in total debt outstanding with the US responsible for roughly 40% of that. It is around triple the value of the global equity market.
Gold and bonds are both safe havens. Why buy gold if a long-term bond pays, say 4.5% and inflation is negligible? The equation changes when inflation rises. Gold becomes attractive when net yields (yields minus inflation) are negative or approaching zero. Why buy a long-term bond if inflation eats up most of the yield? Better to buy bullion.
US long bond yields are all quite high. The only rate the Fed controls is the overnight rate (and the discount rate and interest on reserve balances.) Only prime rates, consumer loans, and savings accounts move with the overnight rate. Longer rates like mortgages and 10 yr are driven by market expectations, inflation, and global demand than direct Fed control.
The demand part, called the bid to cover ratio is still strong – 10-Year Note: 2.59x (up from 2.57x, 20-Year Bond: 2.64x (stable and in-line with the 10-auction average of 2.65x),30-Year Bond: 2.44x (above the historical auction average of 2.43x, showing robust international participation). What’s driving yields is while demand is strong, no one is buying at the start of bidding, instead they are waiting, letting bidding drive up the offered rate. Longer dated yields seem to grind a bit higher every auction.
Of course, a huge portion of the US bond market is foreign investors including central banks who purchase sovereign US debt for their foreign exchange reserves because it is highly liquid, and they need a means of acquiring US dollars needed for the purchase of commodities and other goods and services denominated in US dollars.
When do foreign investors stop buying US Treasuries?
Some countries have already slowed their purchases. That includes major holders like China and Japan, and more recently Saudia Arabia, India, the UAE, and even Canada. Last year for the first since the mid-1990s, gold surpassed US Treasuries in central bank reserves.
US sovereign bond/ Treasury investors are concerned about three things: servicing the massive $39 trillion debt, the growing out of control deficit; and real interest rates approaching negligible/ zero.
Debt financing is becoming a big problem for the US government. To be clear, the Treasury prints money for the Federal Reserve to buy short-term debt.
The Fed is reportedly buying $40 billion worth of short-term Treasury bills per month.
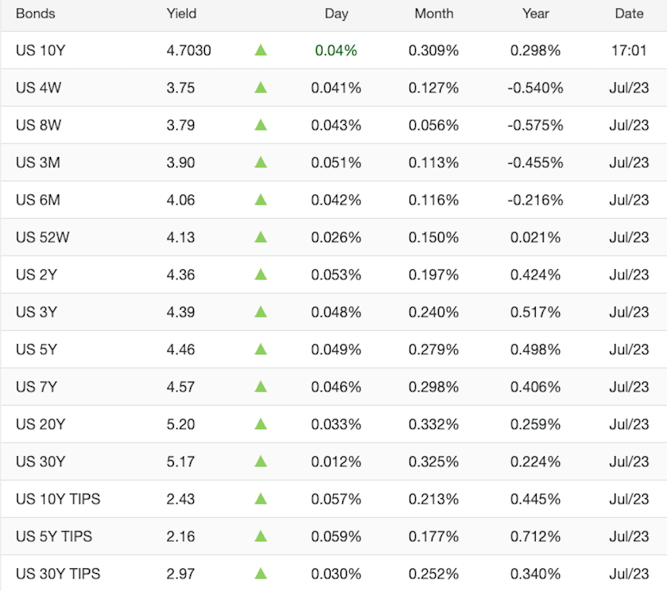
See the table below for a list of current yields. Even the shortest-term T-bill, the 4-week, pays 3.75%.
 Source: Trading Economics
The problem for the Fed is that maturing debt keeps rolling over, even as yields climb and the interest on this debt mounts.
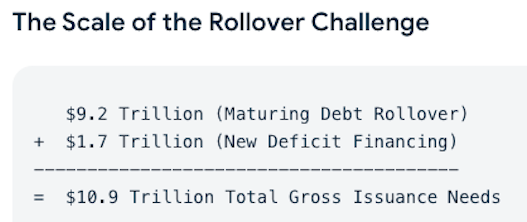
According to the American Enterprise Institute, the US government is rolling over approximately $9.2 trillion of maturing debt, plus $1.7 trillion in new deficit financing, for a total of $10.9 trillion in total issuance needs.
 Mid 2026/Mid 2027
Because the US Treasury relies heavily on short-term Treasury bills, roughly 34% of all outstanding marketable US debt matures and must be refinanced within the year.
A massive wave of debt totaling up to $17 trillion through 2028 must be rolled over as older pandemic-era bills and notes expire.
The government originally borrowed much of this money at very low interest rates near 2%. Refinancing now happens in a market where 2-year are currently 4.3%.
As for the US federal budget deficit, it is projected to climb from $1.9 trillion in fiscal 2026 to over $3.1 trillion by 2036, driven primarily by soaring net interest payments on the national debt, mandatory and military spending.
The US has the largest nominal national debt of any country at $39 trillion. While the US debt-to-GDP ratio of 122% is smaller than Japan’s 204% and Singapore’s 172%, economists are worried about the level of the US’s debt because it restricts the levers that the Federal Reserve can pull.
Fortune writes:
Apollo chief economist Torsten Slok warned the staggering rate at which the U.S. is accumulating debt—about $7 billion per day—is atrophying the nation’s ability to respond to a recession. That’s because the U.S. can’t readily add stimulus to the economy, such as tax cuts or infrastructure spending, lest it go deeper into the hole. But the Federal Reserve also can’t cut rates to incentivize borrowing because it runs the risk of hiking inflation and disrupting the demand balance for new bonds.
(The demand balance for new bonds is the equilibrium between how many new debt securities are issued by borrowers and the total appetite of investors willing to buy them at a given yield – Cover bid. It determines whether bond prices rise or fall and directly influences prevailing market interest rates.)
US government spending is out of control and the only way for the government to pay for its spending is to print money and for the Fed to buy short-term debt. Two things are likely to happen. First, this money is eventually going to find its way into the economy and cause inflation.
While it hasn’t happened yet — the chart below shows the velocity of money, M2V, leveling out around Q4 2025 — arguably the fear of rising interest rates will make people spend cash faster than saving it.
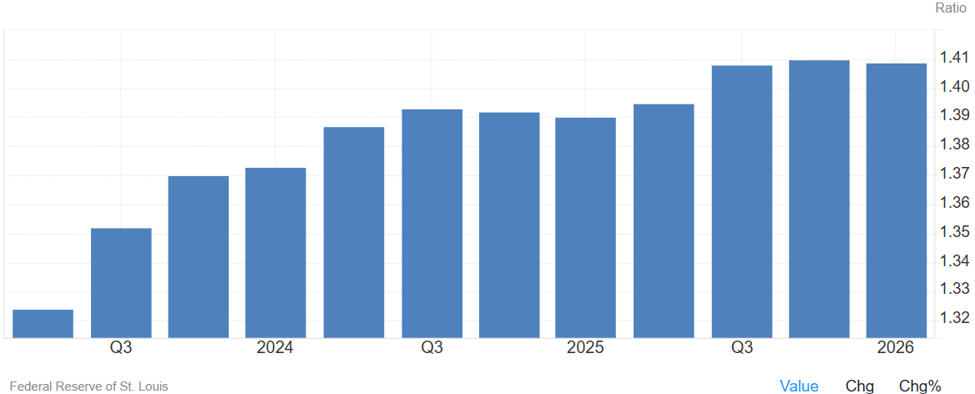 Source Trading Economics, Velocity of M2 Money Stock reached a record high of 2.19200 in July of 1997 and a record low of 1.12600 in April of 2020
Second is that inflation will keep rising because of the war. US CPI inflation was 2.5% in February 2026, the month the war began. By May it had risen to 4.2%. The prospect of peace in June pulled the CPI down to 3.5% but arguably it’s on the rise again, with oil pushing $100/bl.
 Source: Trading Economics
Investors are demanding higher yields on long-term US bonds. The deficit is approaching $2 trillion. The U.S. federal government collects about $5.23 trillion in a typical recent fiscal year. It all costs mega bucks and the only way the government can pay for it is to print money.
People are increasing worried about the US government’s ability to finance its own deficits and debt, but bond investors are also concerned about inflation destroying their yields. When this happens, arguably the game is up and nobody will want to purchase US Treasuries.
Real interest rates
Too unlikely to worry about? Think about this. The benchmark 10-year yield is currently at 4.7% and the inflation rate is 3.5% if we’re using the CPI. That leaves a net yield of 1.2%. But inflation, as I just said, is likely heading higher with the war now intensifying.
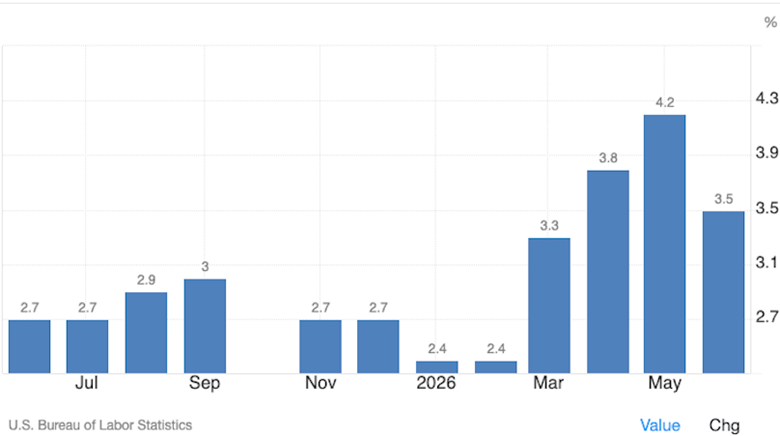 US CPI inflation. Source: Trading Economics
In May inflation was 4.2%. If inflation heads back up to that level, and it very easily could, given where things stand geopolitically, the net yield falls to 0.5%. Who’s going to lock in a 10, 20 or 30-year bond so they can get half-a-percent interest or lower on their money? Real interest rates are heading negative.
The demand for gold moves inversely to interest rates – the higher the rate of interest the lower the demand for gold, the lower the rate of interest the higher the demand for gold.
 Gold vs. Real Yields
The reason for this is simple, when real interest rates are low, at, or below zero, cash and bonds fall out of favor because the real return is lower than inflation – if your earning 1.6 percent on your money but inflation is running 2.7 percent the real rate you are earning is negative 1.1 percent – an investor is actually losing purchasing power. Gold is the most proven investment to offer a return greater than inflation (by its rising price) or at least not a loss of purchasing power.
Bond market and gold market observers keep a close eye on US Treasury yields, particular the yield on the benchmark 10-year note. This is because the 10-year serves as a proxy for other financial products, such as mortgage rates, and it also signals investor confidence.
Historically, we can see the inverse relationship between negative real interest rates and gold, by charting the gold price and the 10-year Treasury’s yield after inflation.
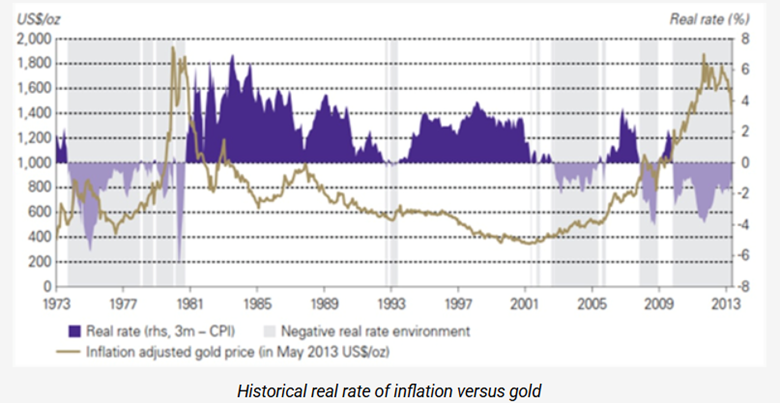
In an article titled ‘The Golden Dilemma’, authors Claude Erb and Campbell found a near-perfect negative correlation of -0.82 (-1 being a perfect negative correlation) between real interest rates and gold prices between 1997 and 2012. Going back further in history, when real interest rates turned negative during the second half of the 1970s, gold moved as high as $1,900 an ounce, as real rates plummeted as low as -6%.
When Paul Volcker, Fed Chair under President Carter and Reagan, hiked short-term nominal interest rates, real rates returned to positive, ending gold’s run. In fact, the gold price continued to drift downward, reaching a 30-year low under $400 an ounce in 2001. The gold bull market of 2010 to 2013 is easily seen in juxtaposition with negative real interest rates which bottomed out at around -4% during that same period.
Historical real rate of inflation versus gold
In the FRED chart below, notice that the gold price between 2013 and 2020 never gets above $1,400, corresponding to the period when the real yield on the 10-year is between about 0% and 1%. However, when real yields “go negative,” as they did around 2011-13, and in 2020, gold prices jumped.

Gold prices jump when real yields “go negative,” as they did around 2011-13, and in 2020.
You cannot dampen the demand for gold at low/negative real interest rates. As long as interest rates are low to negative the demand for gold will grow.
There’s a saying that “six percent interest can draw gold from the moon,” undoubtedly true, but real rates below two percent draw investors to gold.
 Should we worry about the flattening of the yield curve?
US Treasuries Yield Curve
Conclusion
What does it all mean for gold? Well, let’s start with the fact that gold has been rising and falling for the last 50 years but mostly rising.
Gold started at $35 in 1971 and climbed a staircase to $5,626 in 55 years, for a 160X gain or +$15,900%!
Every time gold has risen, it has hit a new high. Also, each time it has hit a new low, the low was higher than the previous low. Remarkably, gold has never, in 50 years, crashed through a previous low. Every high has been higher than the last and every low has been higher than the last.
That brings us to the current situation. Gold has fallen sharply from its January 2026 all-time high of $5,626. The drop was due to the stronger US dollar, expectations that the Federal Reserve will raise interest rates, after a bump in inflation due to the Iran war, and liquidations as investors pivoted toward higher-yielding assets.
The question is, has gold bottomed? If not, when will it? The average percentage drop from high to low across the four periods we highlighted earlier is 39%.
Going from $5,626 down to $3,963 is a 28% drop. Room to drop more? Yes, but the war has widened with the closure of a second Strait, Bab al-Mandab and now, instead of Pakistan being a negotiator they could be fighting.
Saudi Arabia signs mutual defence pact with nuclear-armed Pakistan
The escalation of the war in Iran has oil prices back over $100 a barrel and that is a serious risk to heightened inflation. Caveat – if the ceasefire is not reestablished, if it is then we are back to the economic price shocks narrative.
According to CNBC, Fed funds futures are pricing in a roughly 82% likelihood that the central bank lifts borrowing costs at its September policy meeting, according to CME’s FedWatch tool. A week ago, those odds sat below 53%.
The problem for the Fed is that maturing debt keeps rolling over, even as yields climb and the interest on this debt mounts. A massive wave of debt totaling up to $17 trillion through 2028 must be rolled over as older pandemic-era bills and notes expire. The government originally borrowed much of this money at very low interest rates near 2%. Refinancing it now happens in a market with 2-year yields currently at 4.3%.
The US federal budget deficit is projected to climb from $1.9 trillion in fiscal year 2026 to over $3.1 trillion annually by 2036, driven primarily by soaring net interest payments on the national debt, mandatory spending and increased military spending.
Unsavory as this possible rate hiking cycle is for the government, it’s better than the alternative, of inflation getting so high that foreign investors stop buying Treasuries because real interest rates (net yields), are approaching zero, or worse go negative.
Speaking of central banks, central bank gold buying was a big reason why gold has such a great year in 2025, rising some 65%.
The U.S. and its allies blocking and freezing roughly $300 billion in Russian central bank reserves in 2022 served as a major catalyst for global central banks — especially in emerging markets — to shift toward heavy gold accumulation as a sanction-proof store of value.
On July 23 Trump stated that any damages to ships or cargo resulting from the Middle East conflict will be paid for using Iranian money controlled by the United States. The US has about $2 billion of blocked Iranian funds inside its borders, according to The Business Times. It’s possible Trump’s threat to use controlled Iranian assets to pay for future shipping and cargo damages in the Gulf accelerates de-dollarization risks.
Gold has overtaken U.S. Treasuries in global central bank reserves and recent surveys indicate that more central bank’s plan to decrease their dollar allocations than increase them.
The Conversation reported in June that central bank gold holdings reached a 50-year high, with CBs now holding the highest quantity of gold since 1975 – more than 36,000 tonnes of the precious metal.
The latest information from the World Gold Council shows that in May, central banks bought a net 41 tonnes of gold after selling about 70 tonnes in March, as the chart below shows.
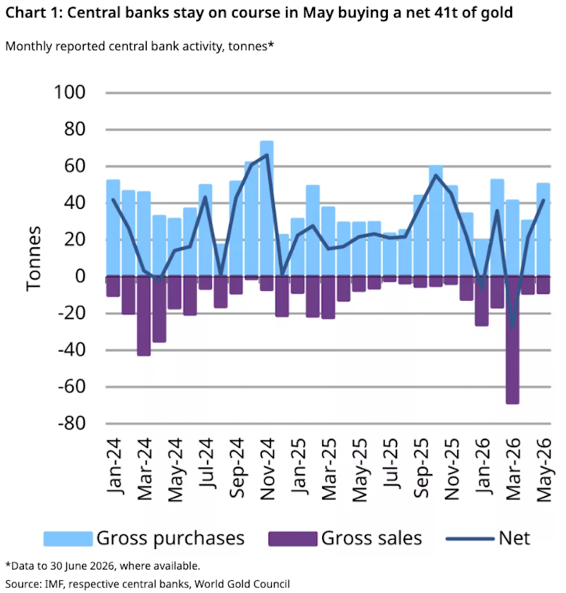
Much of the activity was driven by Poland (18t) and China (10t), with Uzbekistan and Kazakhstan also continuing their monthly net gold buying activity. Singapore also rejoined the list of buyers, reporting a net purchase of 4t, its first monthly net purchase since September 2025.
The purchase or sale of gold-backed ETFs is another factor we need to look at when evaluating the current strength of gold demand.
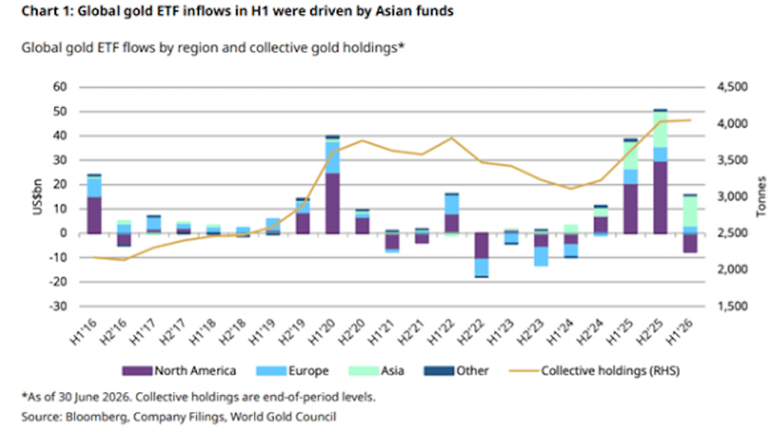
According to the WGC, via Seeking Alpha, global gold ETF flows remained positive overall for the first half of 2026 at US$8 billion, despite facing a sharp correction and widespread outflows in June.
Despite June’s loss, global gold ETF flows remained positive at US$8bn in H1… Asia witnessed outflows of US$2.3bn in June, the worst month on record. Despite so, the region experienced its strongest H1 ever, leading global inflows with US$12bn addition.
In summary, at AOTH we believe gold has bottomed, or is very close. The war is back on and with it, the likely return of US inflation to May’s elevated 4.2%. Or higher, given that both the Strait of Hormuz and the Strait of Bab el-Mandeb are closed to shipping, and the Houthis are striking Saudi Arabian oil tankers.
The options for getting oil and other key commodities out of the Persian Gulf, including LNG, fertilizer and sulfur needed for mineral processing are becoming extremely limited.
As war-related price shocks, possibly morphing into deep rooted inflation, courses through the US economy, the cries for raising interest rates will grow stronger. Intuitively, interest rate hikes are bad for gold, which competes against interest-bearing assets like cash and bonds. But historically, gold has done quite well in rate-hike environments. On average through all 13 Fed-rate-hike cycles in the past 55.5 years, gold achieved impressive 27.2% gains.
Gold also does well when real interest rates turn negative, i.e., when the 10 year bond yield minus inflation go below zero. We aren’t there yet but we’re getting close. Interest on the 10-year is currently at 4.7% and CPI inflation is 3.5%, leaving a net yield of 1.2%. If inflation reclaims its 4.2% May level, the net yield will be only 0.5%.
At the top of the article, I referenced a mainstream media column trashing gold. While I disagree with most of it, I agree with the author’s conclusion: “Gold is down. And now the case for owning it looks a whole lot better.”
Richard (Rick) Mills
aheadoftheherd.com
Read the full article here