

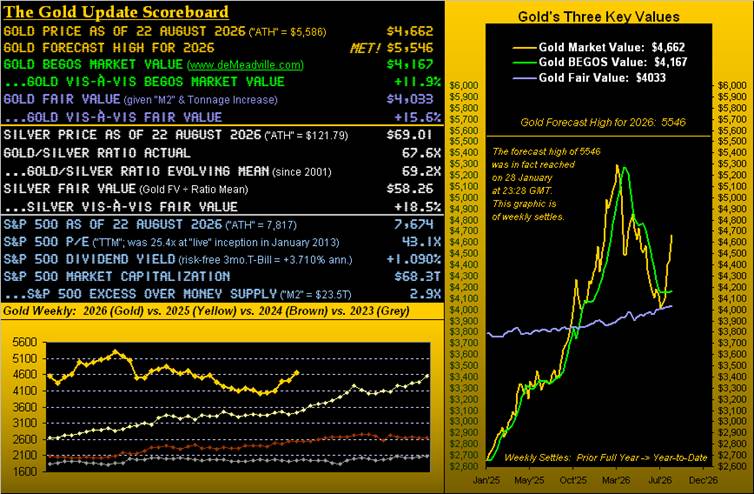
Recall from last week’s piece “Still Higher Gold Ahead” our confirmation of a new Gold weekly parabolic Long trend, price then 4432. Therein, we historically depicted the maximum percentage price increases and durations of the prior 10 such Long trends (since August ’22), enabling us to extrapolate as follows:
- “Conservatively … from here at 4432 we’d reach Gold 4959 during this Long trend.”
And straightaway, Gold went on to settle yesterday (Friday) at 4662: that is already 44% of the distance to 4959 in just the first week of what we calculated would reasonably take some 15 weeks. “Conservatively” indeed! For those of you scoring at home, by both percentage (+5.2%) and points (+230), ’twas Gold’s third-best of the 33 full trading weeks year-to date.
Whilst we at The Gold Update would like to take a bow for inspiring the rally, a hat-tip of deference instead is due to StateSide SecTreas Scott “Buy Back Bonds!” Bessent, whose Wednesday announcement (12:30 GMT) to repurchase longer-term U.S. debt for that of shorter duration sent Gold soaring. Through Wednesday’s remaining trading hours, Gold leapt intra-day as much as +159 points (+3.6%) post-announcement.
“Well don’t cut yourself too short, mmb, ’cause Gold was as much as up 61 points before Bessent…”
(And conspiratorially, Squire, one wonders which entities already had been buying … but we digress).
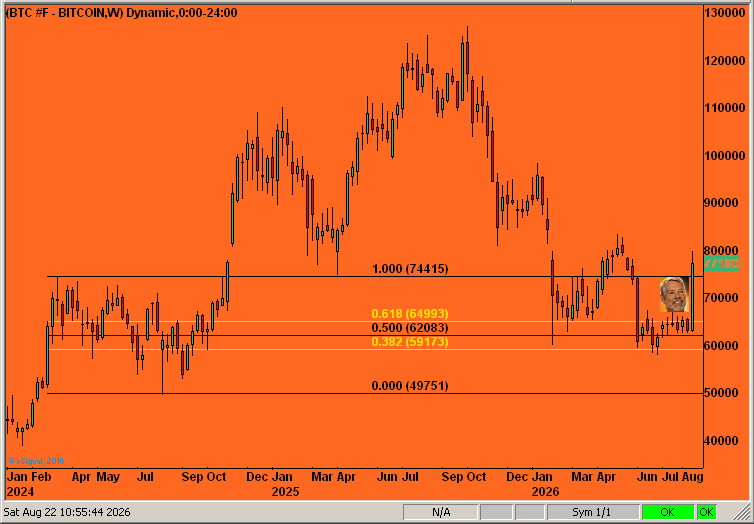
Regardless, the U.S. yield curve having rotated from negative just a few years back to positive prudently supports lowering the Treasury’s potential payout (assuming the usual buyers are there). ‘Course the big BUT becomes the less-yielding Dollar in turn losing appeal, thus Gold getting the bid. BOOM! Why, even Bitcoin benefitted in a buying binge, breaking back (again) above our “fib support zone” as the rightmost weekly bar “Sayled” higher:
“So are you REALLY jumping on the Bitcoin bandwagon mmb???”
We remain strictly an ongoing observer, Squire, the point in this case being non-dollar money pools across the liquidity spectrum benefitting from the Buck’s bad luck in recording its fourth-worst weekly percentage loss this year. Conversely for the €uro, ’twas its fifth-best, the Swiss Franc its second-best, and Bitcoin its best weekly net percentage gain (+22.6%) since that ending 01 March 2024.
As aforementioned, ‘twas Gold’s third-best week of the year as the fresh parabolic Long trend kicked into yet a higher gear. Big Numbers for Big Gold here by the weekly bars as they appear:
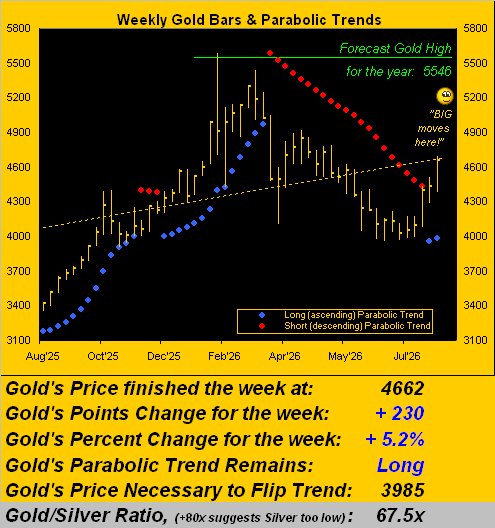
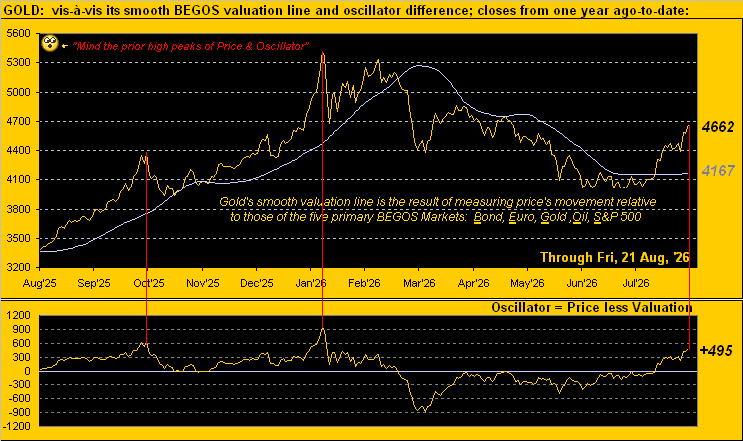
But perhaps too big, too fast? As pro-Gold as we are, ’tis upon the ground that one’s feet ought be bound. To be sure, the yellow metal zoomed up this past week on the legitimate fundamental of Dollar weakness, (albeit we’ve demonstrated over the years that Gold plays no currency favourites even as Dollar debasement is the primary driver of Fair Value). That stated, too, we’ve our BEGOS Market Value for Gold depicted as 4167 in the opening Scoreboard. For additional context, here next are Gold’s daily closes from one year ago-to-date, the emphasis therein being on the oscillative peaks in the lower panel. They are connected with respective red lines to price’s peaks. Whilst we’re not necessarily at a peak today, the points’ deviation of price above its smooth valuation line is again becoming extreme, indeed the most so since the six consecutive trading-day span from this past 22 January into the All-Time Intra-Day High of 5586 on 29 January:
What can stem Gold’s recent robust uptrend? Two non-technical factors come to mind:
- Next week’s array of 11 incoming metrics for the Economic Barometer includes the “Fed-favoured” Personal Consumption Expenditures for July. Consensus calls for increases (+0.1% headline, +0.2% core) over those of a completely benign June, such uptrend then perhaps becoming construed as Gold negative. And there are a number of saber-rattling Federal Reserve officials of late with an eye towards raising The Bank’s Funds rate. Let’s see how FedHead Kevin “The Warrior” Warsh this next Friday addresses any notion in Jackson Hole of jacking up rates.
- As the USA/IRN war seems on the path to “inevitibly” re-heat, as herein oft stated, the bid for Oil shall re-elicit the bid for the Dollar, which during warring days has been Gold negative. ‘Twould be catalytic to close that gap as just shown between Gold’s price and its BEGOS Market Value. Yes, Gold has only just embarked on its new weekly parabolic Long trend; but down weeks within overall uptrends come with the territory: Gold’s previous Long trend lasted 14 weeks in which five were down; it happens.
The point is: we don’t see the new Long trend being “Short-lived”; but hardly do see it as simply uni-directionally up.
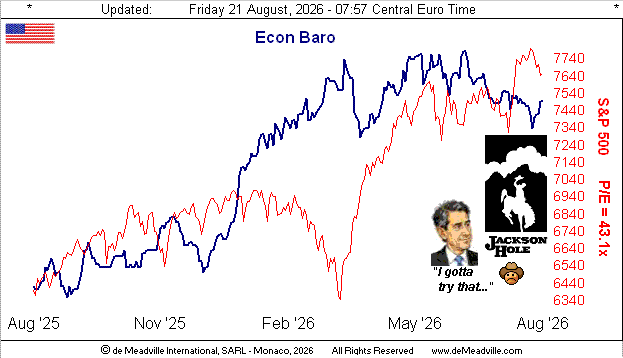
Meanwhile, trying to buck being what had recently seemed uni-directionally down is the Econ Baro. 12 metrics came into the Baro this past week, of which eight were better period-over-period, the notable standouts being July’s Building Permits and the Conference Board’s Leading (i.e. “lagging”) Economic Index, the latter having reported a positive bias for only the fourth time in the past ten months. As to the Building Permits, they beat consensus and those for June, which were also revised upward: this may be positive for August’s Housing Starts that for July missed consensus and were less than June, those therein revised lower. Thus in going to the Econ Baro, let’s cue  “If I had a hammer”
 –[The Weavers, ’50]:
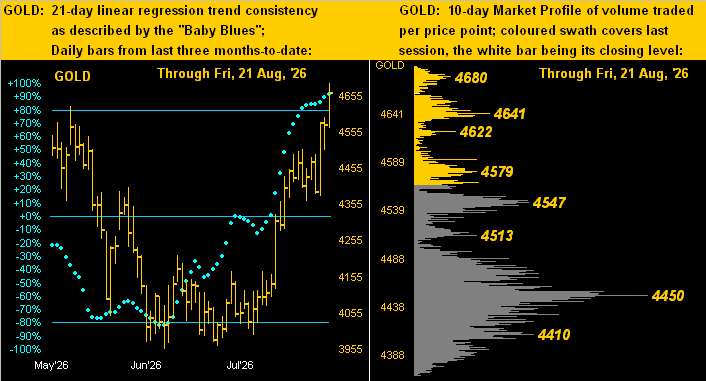
To our two-panel Gold graphic we go, featuring the daily bars from three months ago-to-date on the left and 10-day Market Profile on the right. Remember when the baby blue dots signaled a “buy” (upon crossing above the -80% axis) per the 02 July close at 4136? Price today is +12.7% higher. And the Profile’s notable volume-dominant support levels are now 4547 and 4450:
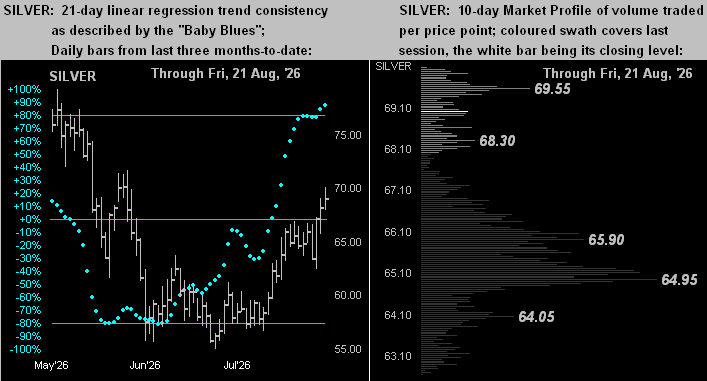
Sister Silver has been a bit less robust on her recent upside run in not having reached May’s higher levels (as already has Gold). Yet similar to Gold, her “Baby Blues” (below left) “buy” came per 30 June’s close at 59.05; today she’s +16.9% higher at 69.01. As for her Profile (below right), 64.95 stands as her most volume-dominant supporter:
Toward wrapping, we just had the closing of Q2 Earnings Season. Specific to the S&P 500’s 503 constituents, 443 reported within the calendar season, of which 349 (79%) bettered their bottom lines from Q2 a year ago: that by percentage improvement ranks second-best across the past 12 reporting quarters. ‘Tis the good news.
However, you regular readers therefore know the bad news: the overall level of earnings remains significantly insufficient to support an S&P yielding but 1.090% with our “live” (ttm) price/earnings ratio of now 43.1x, which in turn is +70% higher than ’twas when conceived at 25.4x back in January 2013. (For you WestPalmBeachers down there, that is mathematically suggestive of a correction in the S&P of worse than -40%). Or to reprise from “The Eiger Sanction” –[Universal, ’75] what Reiner Schöne (as Karl Freytag) exclaimed to Michael Grimm (as Anderl Meyer) and Clint Eastwood (as Jonathan Hemlock) whilst all were desperately clinging to the iconic north face: “The ice is cracking!!”
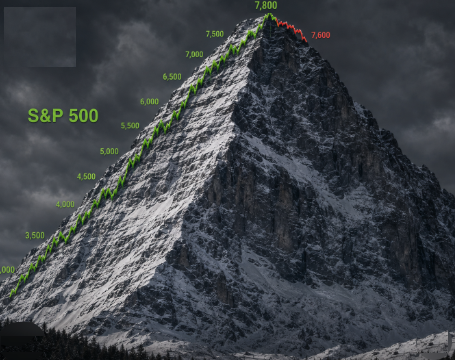
But Gold is cracklin’!!
Cheers!
…m…
www.TheGoldUpdate.com
www.deMeadville.com
and now on “X”: @deMeadvillePro
deMeadville. Copyright Ⓒ 2010 – 2026. All Rights Reserved.
Read the full article here