

One could say the week got off to a bang following the shooting at the White House Correspondents’ Dinner.
A ceasefire was extended, but talks have broken off again. The blockades remain. What does that mean for the markets? Markets are in transition. Stocks are rallying, but the action suggests a top; gold is consolidating, while oil prices are event-driven. There are growing problems globally because of the ongoing war and blockade. Growing fuel shortages are sparking rationing in some countries. Some countries are facing protests due to sharply rising fuel prices. A number of Mid-East countries that cannot get their products to market are quite vulnerable. Plants are being mothballed and could take months to reopen. A few Mid-East countries could face a debt crisis given the lack of incoming revenue. Some might sell U.S. treasuries to raise cash, while requests are being made for swap lines with the U.S. Treasury to raise cash. The war may be regional, but its effects are global.
NVIDIA has been the star of the MAG7. NVIDIA and the MAG7 have led the recent rally, but only one, Amazon, has reached all-time highs again. NVIDIA, and by extension the MAG7, is the subject of the chart of the week.
Stock markets were up this past week, with the S&P 500 and the NASDAQ notably making all-time highs. The Dow Jones Transportations (DJT) also made an all-time high but reversed and closed sharply lower. The Dow Jones Industrials (DJI) did not join the party. A divergence? Oil rallied sharply reversing the previous week’s losses. An example is Enerflex Ltd. which reported increased revenue, expanded gross margin, lower net debt, and greater free cashflow, pays a dividend, and is held in the Enriched Capital Conservative Growth Strategy.* While the ceasefire was extended, the blockade by both the U.S. and Iran remains. Gold suffered as oil prices rose, which also sparked an uptick in the US$ Index and bond yields.
We are approaching the two-month mark of this war. The effects of the war and the blockade of the Strait of Hormuz are just beginning to be felt. The worst is yet to come, even if it ended tomorrow.
The big event this week is the Bank of Canada and the Fed announcing their interest rate decisions on April 29.
The expectation is that both will stand pat. Key after is the usual speech from Tiff Macklem and Jerome Powell.
It’s been a chilly spring. Warmer weather is on the way. Have a great week!
DC
* Reference to the Enriched Capital Conservative Growth Strategy and its investments, celebrating an
8.17 – year history of 175% growth (annual 13%), is added by Margaret Samuel, President, CEO and Portfolio Manager of Enriched Investing Incorporated, who can be reached at 416-203-3028 or [email protected] This information should not be construed as an offer, or a solicitation of an offer or sale of any security. Past performance does not guarantee future returns.
“Rockefeller once explained the secret of success. ‘Get up early, work late – and strike oil.’”
—Joey Adams, American comedian, vaudevillian performer, radio host, nightclub performer, author of Borscht Belt (1973), inducted into the New York Friars Club 1977; 1911–1999
“The truth is, about the Middle East is, had there been no oil there, it would be like Africa. Nobody is threatening to intervene in Africa.”
—Wesley Clark, retired U.S. army officer, West Point graduate, Rhodes Scholar, awarded Silver Star during tenure in Vietnam, Supreme Allied Commander Europe for NATO 1997–2000, Presidential Medal of Freedom; b. 1944
“Some hedge fund managers have made big bucks trading oil futures – George Soros is one.”
—Gary Weiss, American investigative journalist, columnist, contributing editor for Condé Nast Portfolio and Businessweek articles, exposed organized crime on Wall Street and the Salomon Brothers bond trading scandal in the 1990s, covered the 2008 financial crisis and its aftermath; b. 1954
A market in transition
If you have been confused as to what is going on of late, you’re not the only one. When everything is trading on the whim of a Truth Social post from the president, you get what has been happening. Confusion. This is what pushes us to pull back and look at the big picture. Once one does that it may not clear up the confusion, but it hopefully makes things a little clearer. Markets can’t be run on a whim. But that’s what we have been getting. The result: stocks rise, gold rises, oil plummets. Then it reverses, sometimes the very next day, and then stocks fall, gold falls, and oil rises. Noise. Lots of noise.
But all that noise forms patterns. And it is from these patterns that we can hopefully discern what is going on and what is likely to happen. Here’s how we see it.
Stock market. The big trend remains up. But the market is mature, suggesting that a corrective break could occur at any time. We did have a pullback recently that pushed some indices into correction territory, but it didn’t hold and turned around with many of the indices soaring to new all-time highs. There were reasons for that, such as record corporate profits, an uptick in money supply growth, continuing debt growth, and a belief that the situation in the Gulf will resolve itself as it is in everyone’s interest. Yes, the rally has been widening, and big money is generally behind the rise. The big question is: when will it reverse to the downside and what will be the trigger?
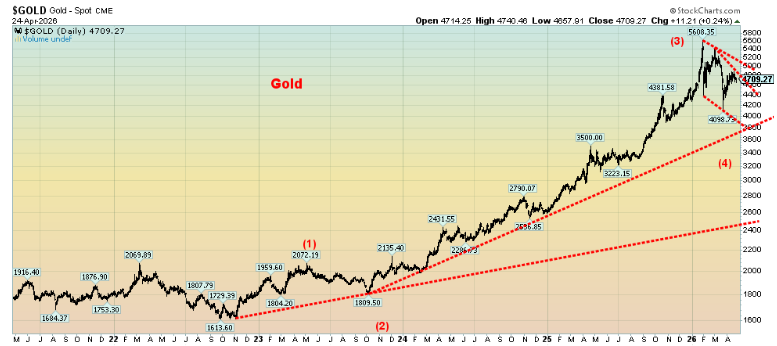
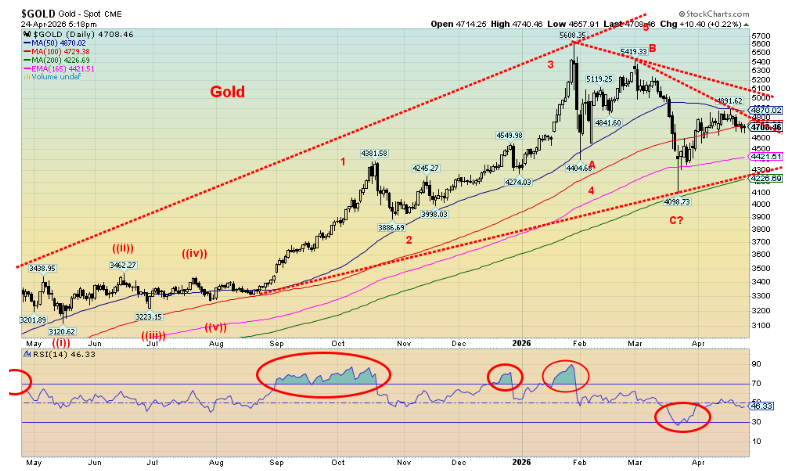
Gold. This in our opinion is the clearest. Gold surged in late January to new all-time highs above $5,300. Then it sold off sharply and since then has been consolidating. Again, the question is, when will it break out and what will be the trigger? So far, the run-up for gold has been very impressive, driven by central bank buying and speculative fervor. Since gold has been free trading, there have been three major bull markets: 1971–1980, 2001–2011, and the current one that got underway in 2015, although it didn’t really get going until after 2022.
Oil. Our read on oil is the hardest as it is event-driven. If tensions and war heat up in the Middle East, oil is likely to continue to spike higher. If the situation resolves itself, oil is likely to fall, although not as much as many would like. The full economic fallout from the war in the Gulf has not yet played out. That’s to come, but it is not necessarily a driver of the oil price. Whether the current wave up is the start of a major impulse to the upside is to be determined. Otherwise, all this may be just a sharp, news-driven event that eventually clears itself up.
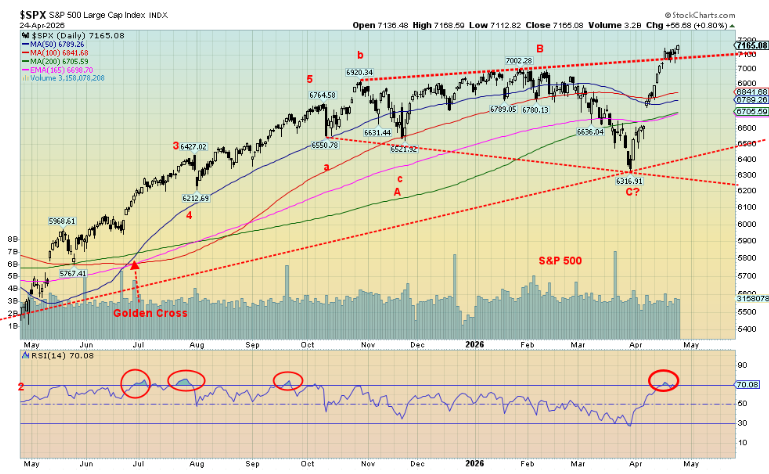
Source: www.stockcharts.com
The S&P 500 appears clear to us. Since that important 2022 low, we have made five distinct waves to the upside. The fifth wave is not yet complete. It is, however, the final advance before a more significant corrective phase sets in. We have a conflagration of cycles pointed into this time frame: the four-year cycle dating from the 2022 low (range 2025–2027), the six-year cycle also dating from the 2022 low (range 2027–2029), the 18-year cycle dating from the 2009 low (range 2024–2030), and the big one, a 90-year cycle dating from the 1932 low (range 2012–2032). The latter cycle is the most unclear one because we’ve only seen two that are clear, in 1842 and 1932. Looking at long-term charts, we also note important lows in 1762, 1672 or 1696, and 1555, lows that fit well with the range of 90-year cycles.
We can’t rule out higher highs. We could reach higher, but we’d have to firmly break out of what appears as a broadening top pattern. That means new highs above 7,120. However, the fundamental background is becoming more bearish because, as we note, we have not yet seen the complete economic fallout from the war in the Gulf.
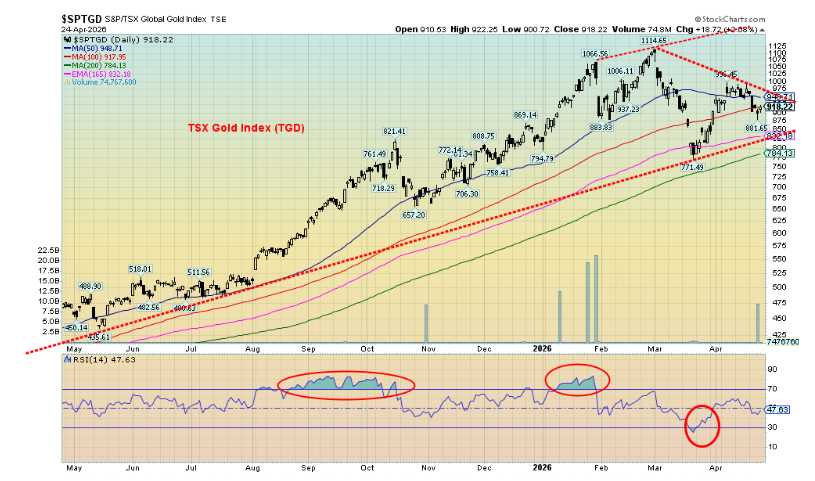
Gold is the clearest to us. The January high at $5,608 was the end of a huge impulse up wave. Our count was wave 3 of five, dating from the 2022 low. This is a wave 4 correction that has not yet finished. What’s key will be a breakout: first above $4,900 and then, more importantly, above $5,000. That low could occur anywhere from now until July 2026. Cycle-wise, our last important 7.8-year cycle was seen in 2015, followed by the 2022 low. The next 7.8-year cycle low is not due until 2029/2030–2031 (range 7–9 years). We know we are in the first phase of a new up cycle. The subdivision of the 7.8-year cycle is either two cycles of roughly four years or three cycles of 2.6-years (range 24–38 months). We are in the midst of that correction now. Once finished, we expect a breakout that could take us as high as $6,000–$6,100, although higher could also be in the cards.
Source: www.stockcharts.com
Source: www.stockcharts.com
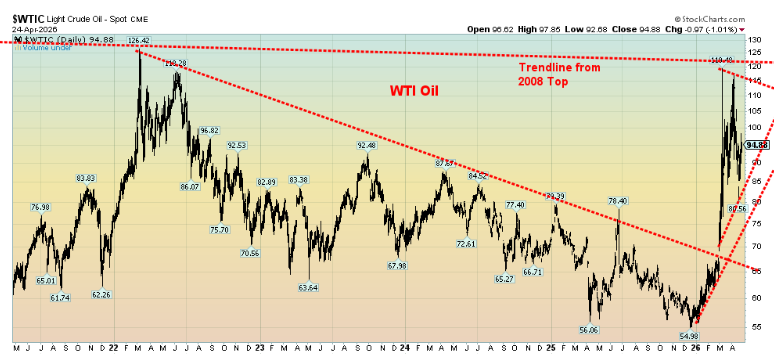
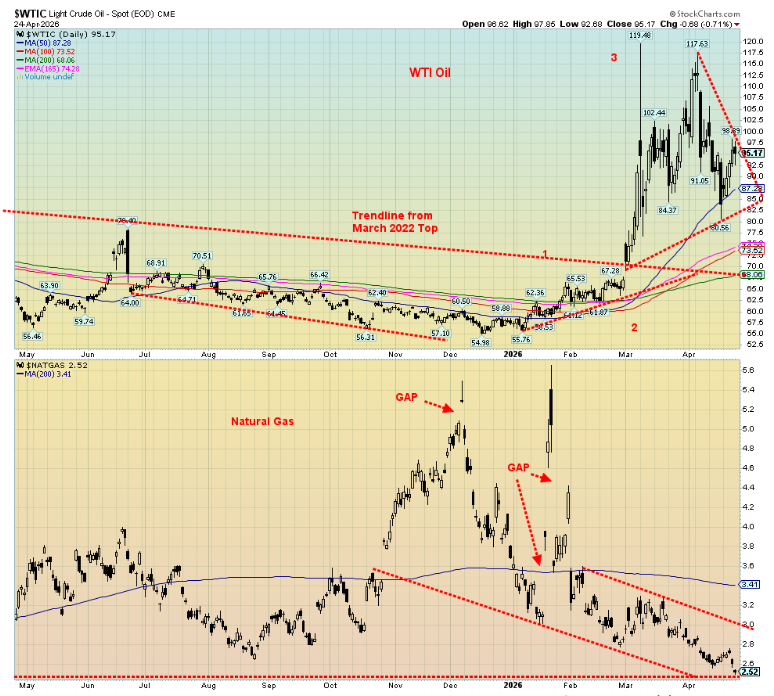
The hardest one to predict is oil as it is totally event-driven. Since that spike that took us to $119.48, we have been forming a consolidation pattern with numerous up and down days (noise). However, overall, we could be forming a large symmetrical triangle that should break out to the upside to complete this up wave. We are currently approaching a trendline from the 2008 top joining the 2022 top. It appears around $120. To go higher, that must be taken out. A failure, based on a resolution to the U.S./Israel/Iran war, could see oil prices instead break down. A break back under $85 would be the first sign but a break under $80 would finish oil’s rise. From that perspective, predicting where oil prices are going to go is difficult.
The best cycle we can determine is one of roughly 12 years (range 10–14 years). Starting in 1973, just before the event-driven Arab Oil Embargo, we can discern important lows in 1973, 1986 (13 years), 1998 (12 years), 2009 (11 years), and 2020 (11 years). Another important low is not due until 2030–2034. A firm breakout above $120 will ensure we are headed higher. Just above that lies the Russia/Ukraine war top in 2022 at $126.
Trouble for Middle Eastern countries
As if the Middle East, and by extension the rest of the world, doesn’t have enough problems because of the war and blockade of the Strait of Hormuz by both Iran and the U.S. Some of the countries are teetering. The Strait of Hormuz (Persian Gulf and Gulf of Oman) is the world’s biggest and most crucial choke point. The others are the Strait of Malaca (Adaman Sea and Java Sea), the Strait of Bab-el-Mandeb (Red Sea and Gulf of Aden), the Suez Canal (Red Sea and Mediterranean Sea), the still crucial Panama Canal (Atlantic and Pacific Oceans), the Danish Strait (Baltic Sea and North Sea), the Turkish Strait (Bosporus and Dardanelles), and the Strait of Gibraltar (Mediterranea Sea and Atlantic Ocean).
Blocked behind the Strait of Hormuz because of the ongoing war and blockades of the U.S. and Iran are 20–25% of the world’s oil supply, 20% of the world’s LNG, particularly Qatar and UAE, 30% of internationally traded fertilizers including urea and ammonia, and roughly 50% of the world’s sulphur trade, essential for fertilizers and metal processing. Primary countries impacted by the blockade are in Asia: China, India, Korea, Japan, Taiwan, and other Southeast Asia countries Pakistan, Sri Lanka, Bangladesh, Myanmar, Vietnam, etc. Also affected is the EU, especially Italy and the U.K. Protests against higher fuel prices have broken out in Ireland and France resulting in confrontations between police and the protestors. Others are impacted because of spikes in prices for oil, LNG, and fertilizers along with growing shortages (jet fuel). Overlooked are negative impacts on several African countries. A reminder that the Americas (North and South) are not immune, either, with sharp price increases, particularly for oil, gas, heating fuel, jet fuel, and gas, including diesel. In other words, the impact is global. The damage done will take months to years to repair and cost billions.
So far, little has been said about the negative impact on the Middle Eastern countries of Iran, Iraq, Kuwait, Bahrain, Qatar, UAE, and Saudi Arabia. Here it is stoppage of exports, revenue loss, shutdowns of plants (e.g., LNG plants that take months to restart if shut down), high insurance, and a huge drop in trade. Many of them lack alternatives to ship. An exception is Saudi Arabia, but its pipeline to the Red Sea is vulnerable as it has been bombed once already. Also, it’s difficult to ship out through the Strait of Bab-el-Mandeb due to blockage by the Houthis of Yemen.
Quite simply, this is a global mess. The real negative economic impact is yet to come and could push the world into a steep recession or worse. Rationing is already taking place in a number of South Asian and Southeast Asian countries. The EU has discussed it.
So, it’s not a surprise to suggest that the countries in the Middle East most vulnerable to a potential sovereign debt crisis are Iraq, Iran, Kuwait, and Bahrain. Elsewhere, others impacted because of high fuel prices are Egypt, Senegal, Mozambique, Malawi, and in the Americas Argentina and Ecuador. For the Middle Eastern countries, they can tap into their reserves to tide them over. Except that causes another problem in that reserves are held in U.S. dollars, usually in the form of U.S. treasuries. Any amount of selling could spark a run on the U.S. dollar and the U.S. bond market.
The result of this is that many are requesting currency swap lines through Treasury Secretary Scott Bessent. The purpose is to stabilize markets and prevent a run on the U.S. dollar and the U.S treasury market. The biggest requests come from the UAE and to a lesser extent others in the region. But the real danger lies with the countries most vulnerable to the blockades and war that could see some slip into financial crisis if this lasts beyond 90 days (we’re now roughly 58 days into this conflict). As we noted, the countries most vulnerable to a debt crisis are Kuwait, Bahrain, Iraq, and Iran. Saudi Arabia has a lot of U.S. treasuries ($160.4 billion) as does the UAE ($119.9 billion). Others are Kuwait ($66 billion) and Iraq ($42 billion).
The swap lines are not a done deal just yet as there is opposition in Congress. However, the immediacy of the problem is well known and needs to be addressed soon if a bigger crisis is to be held off.
Source: www.stockcharts.com
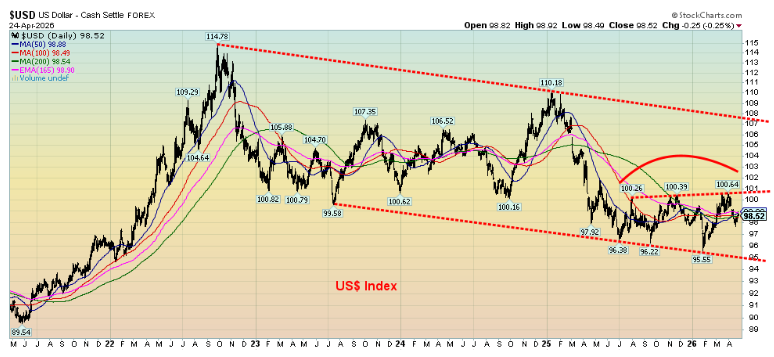
The US$ Index already is in a downtrend from that last major high back in 2022. Since then, it is down 14%. While the US$ Index is consolidating above the lows near 95.50, it has so far failed to firmly break out to the upside. It needs to get above 101 to suggest higher. Otherwise, a drop under 97 is negative and could send us back to the lows.
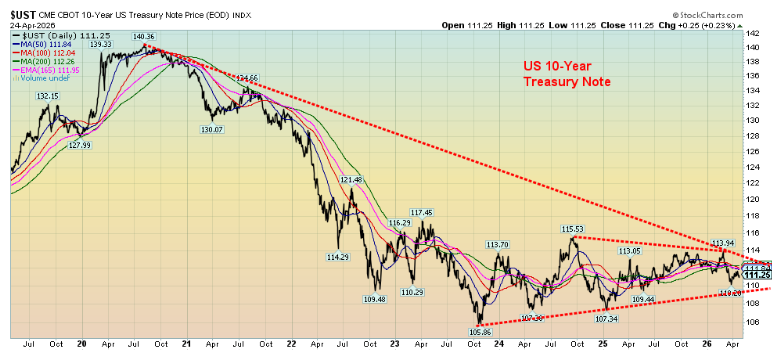
The price on the U.S. 10-year Treasury note has been in a downtrend since peaking during the pandemic. Price, which moves inversely to yields, has fallen over 20% since that peak in 2020. For the past 2+ years we have been in a sideways pattern that appears poised to break to the downside. A breakdown under 109 would confirm that. We’d need to get firmly above 114 to suggest higher prices. However, the pattern appears to us as sideways consolidation pattern following a steep decline. Until it is resolved, an upside break could also occur.
Source: www.stockcharts.com
The full economic impact of the war and blockade in the Strait of Hormuz has not been felt yet. It is a delayed reaction; the worst is yet to come. Caveat emptor.
Chart of the week
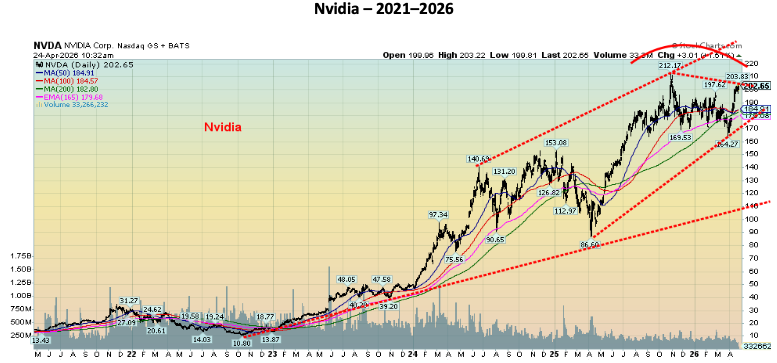
Nvidia – 2021–2026
Source: www.stockcharts.com
The MAG7 continue to be in the news. The TV talking heads continue to pump the MAG7 as the greatest and tout how this great bull market will continue. Or will it? Naturally, we can’t say for sure, but this chart of Nvidia is showing considerable weakness even as it has not broken down – yet. Nvidia has been the big gainer for the MAG7 over the past five years, up an incredible 1,276%. Its closest contender is Google, up about 199% in the same period.
|
Stock |
5-Year Return % |
1-Year Return % |
Year-to-Date Return % |
|
Meta |
126.5% |
25.5% |
12.6% |
|
Apple |
112.0% |
36.0% |
0.2% |
|
Amazon |
57.4% |
39.6% |
12.6% |
|
|
198.5% |
108.6% |
7.1% |
|
Microsoft |
69.6% |
9.0% |
(13.2)% |
|
Nvidia |
1291.6% |
94.4% |
10.8% |
|
Tesla |
56.5% |
44.8% |
(16.6)% |
|
|
|
|
|
|
S&P 500 |
72.5% |
30.1% |
4.2% |
|
NASDAQ |
78.3% |
43.7% |
6.0% |
|
Gold |
165.3% |
41.2% |
9.4% |
Source: www.stockcharts.com
But that’s over five years. Over one year Google has been the best performer, up about 109%. Year to date, the big winners have been Meta and Amazon, both up 12.6%. Notably, two are actually down on for 2026: Microsoft, off 13.2%, and Tesla, down 16.6%. Not all are pulling their weight. A divergence?
No, we can’t tell whether Nvidia is poised to fall from here just yet. We are below the all-time high at $212.17 in October 2025. Nvidia is down only 2.3% from that high and appears poised to break it. Given the declining volume on this rise, we suspect that the rally will eventually fade, followed by a down swing. Failure to make new highs could set up the potential for a double top. However, new highs can’t be ruled out. Given that two of the MAG7 are now down on the year, this can be interpreted as the MAG7 are losing their mantle as the leaders of the market.
The group is still reporting good earnings and, in some cases, earnings per share are beating estimates. But, overall, earnings growth has slowed from roughly 30%/year to the 10%–17%/year range. The MAG7 are still significant winners for both the S&P 500 and NASDAQ, but their share is softening as the market broadens.
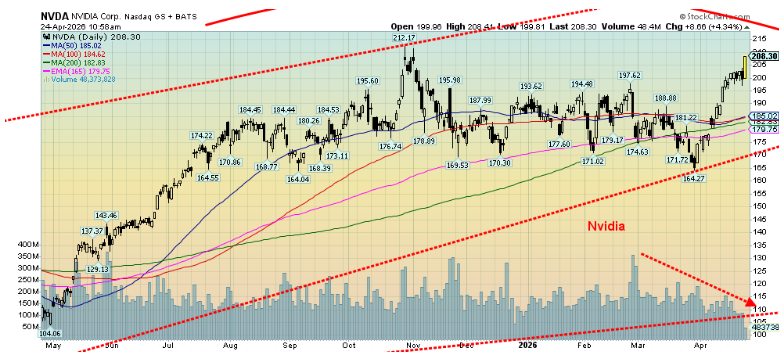
Nvidia – 2025–2026
Source: www.stockcharts.com
What to watch for? A break of $197, the recent low, might be the first sign of trouble. More important is that rising trend line, currently near $170. The 200-day MA is near $183.00. The pattern doesn’t give us a warm and comfy feeling, so we would be cautious jumping on the bandwagon, despite all being the leaders in AI. That said, Nvidia has the highest expectations. Tesla and Microsoft look weak.
Incidentally, a $10,000 investment in Nvidia at the 2022 low of $10.80 would be today worth about $193,000.
Stocks
Source: www.stockcharts.com
War in the Middle East. A potential collapse in the private equity/credit market. A sovereign debt crisis. Piffle. Happy days are here again as new all-time highs are made. Okay, not everywhere. The S&P 500 and the NASDAQ leaped to new highs this past week as the MAG7 caught a bid. But then new all-time highs were also seen for the S&P 400 (Mid), the S&P 600 (Small), the S&P 100 (OEX), and the Russell 1000, 2000, and 3000. New highs were also seen for the Dow Jones Transportations (DJT), the S&P 500 Equal Weight Index, and the Dow Jones Composite (DJC). However, all three indices made their new all-time highs, then turned and closed down on the week. Noticeably, not making new all-time highs was the Dow Jones Industrials (DJI). A divergence with the DJT? Dow theory says the indices must confirm each other. A non-confirmation.
On the week, the S&P 500 rose 0.6%, the DJI fell 0.4%, the DJT fell 6.8% as fears of fuel costs battered the components, while the NASDAQ was up 1.5%. The S&P 400 (Mid) fell 0.1%, while the S&P 600 (Small) was up 0.7%. The S&P 500 Equal Weight Index fell 0.5%. The NY FANG Index rose 1.5%. In Canada, the TSX Composite fell 1.3% and the TSX Venture Exchange (CDNX) was down 4.2%. Bitcoin was up 0.1% and appears to be losing momentum.
Source: www.stockcharts.com
In the EU, the London FTSE was down 2.6%, the EuroNext was down 2.6%, the Paris CAC 40 was down 2.4%, and the German DAX was down 2.2%. In Asia, China’s Shanghai Index (SSEC) rose 1.0%, the Tokyo Nikkei Dow (TKN) was up 1.1% to new all-time highs, Hong Kong’s Hang Seng (HSI) fell 0.9%, and India’s Nifty Fifty fell 1.9%. India is being hit hard by the Gulf war and blockades. The MSCI World Index ETF (ex U.S.) fell 1.6%. Not a good week for the EU and a mixed one for Asia.
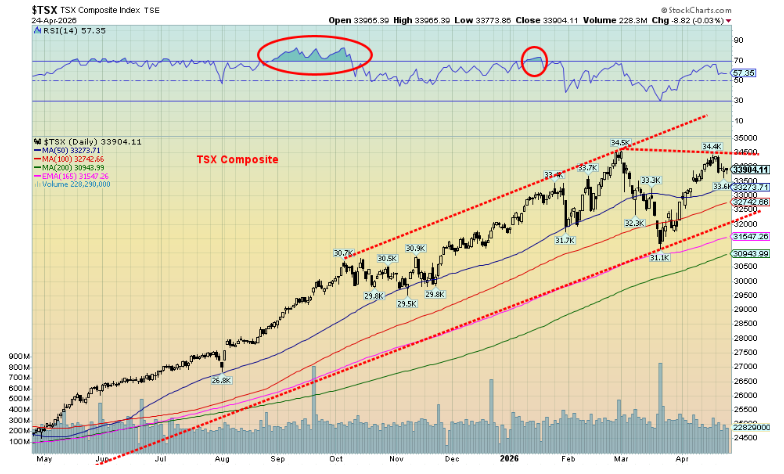
It was not a good week for the TSX. Oddly, the TSX 60 made new all-time highs (barely) and then turned down, losing 1.1%. That came even as the TSX Composite did not see new all-time highs, losing 1.3% on the week. Only six of 14 subindices registered gains on the week, led by Energy (TEN) up 4.4%. Materials (TMT) led the way down, off 6.7%, while Golds (TGD) fell 6.1% and Metals (TGM) dropped 4.9%.
Source: www.stockcharts.com
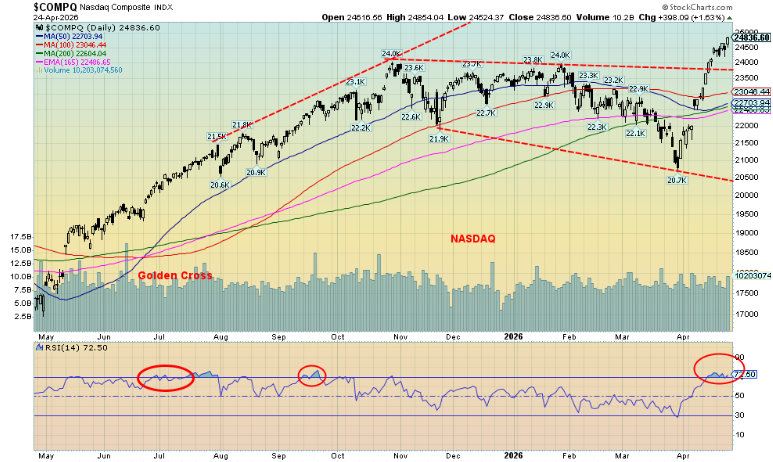
The stock markets continue what we see as topping action. Volumes are down and while some (S&P 500 and NASDAQ) make all-time highs, the DJI does not, while the DJT makes an all-time high and then reverses, closing sharply lower. None of this bodes well. All this happened despite the Michigan Consumer Sentiment Index making record lows, while retail sales came in above expectations, largely because of the price jump for gas.
Both the S&P 500 and the NASDAQ have broken out of what we thought could be forming a broadening top. For the S&P 500, a return and breakdown through 7,000 would be negative while for the NASDAQ, under 24,000 and especially under 23,500 could signal the rally is over. The background noise is negative, but corporate profits remain high and the consumer is still spending. And the MAG7 are back – or are they? A number of FAANGs made all-time highs this past week, including Amazon, AMD, and Broadcom. AMD was the big star, up 24.9% on the week. Notably, Netflix fell 5.0% and Tesla dropped 6.1%, while ServiceNow fell 6.7%. For Trump fans, Trump Media (DJT) fell 8.9%
This is a big week for markets. The Bank of Canada (BofC) reports its interest rate decision on Wednesday, April 29, with the Fed reporting its decision that same day, in the afternoon. Both are expected to remain unchanged: 2.25% for Canada and 3.75% for the U.S. In both cases, all ears will be tuned to the conferences that follow from BofC’s Tiff Macklem and the Fed’s Jerome Powell.
Bonds
Source: www.tradingeconomics.com, www.home.treasury.gov, www.bankofcanada.ca
In a surprise move, the DOJ ended its investigation into Fed Chair Jerome Powell. This was a barrier to the potential appointment of Kevin Warsh as the new Fed chair. In any case, Powell has indicated he most likely will remain as a governor as he is allowed to. Will this cause difficulty for the new Fed chair? Note, while the DOJ said they are ending their investigation into Powell, President Trump contradicted them saying it hasn’t.
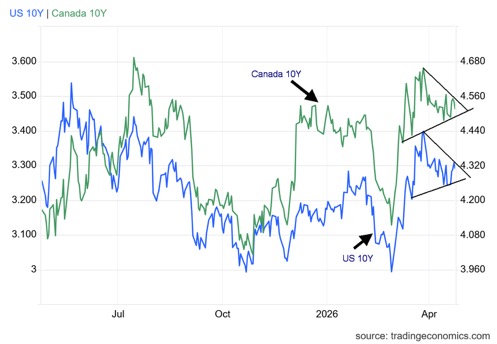
Bond yields are treading water right now. They barely moved this past week, although as oil prices rose bond yields followed. The U.S. 10-year Treasury note rose to 4.31% from 4.25% while Canada’s 10-year Government of Canada bond rose to 3.46% from 3.45%. The 10-year–2-year spreads remained largely unchanged but continue to point to a recession. We seem to be forming symmetrical triangles on both the U.S. 10-year and the Canadian 10-year. A break above 4.40% (U.S.) and 3.50% (Cdn) could send us higher. A drop under 4.25% (US) and 3.40% (Cdn) could send us lower. But the reality is, we don’t expect to see a lot of movement for bond yields – unless they are hit with an unexpected event.
Gold and silver
Source: www.stockcharts.com
The gold bugs must be frustrated. Since this war started in February, gold has gone nowhere. In between, there have been some sharp ups and downs sparked mostly by higher bond yields and a rising US$ Index. Both are anathema to owning gold. We’ve rallied off the lows, only now to run into resistance as we suffered a down week. Gold remains down 16% from its all-time high seen in January. Grant you, gold is still up 48% over the past year. Many would be more than happy with that return.
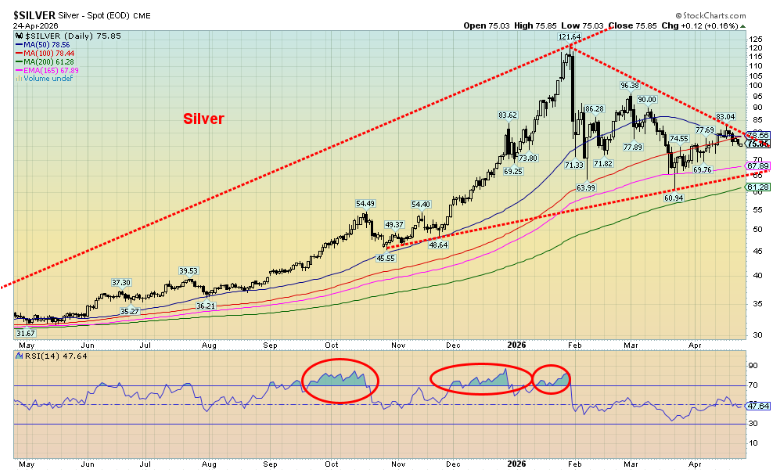
This past week gold fell 2.9%, silver dropped 6.6%, and platinum fell 4.7%. Palladium was off 4.5% while copper fell 0.8%. The gold stocks were hit with the Gold Bugs Index (HUI) down 6.3% and the TSX Gold Index (TGD) down 6.1%. Both platinum (-1.4%) and palladium (-7.0%) remain down on the year. Like oil, gold appears to be event-driven by the ongoing conflict between the U.S./Israel/Iran. War on, gold falls; war on hold, gold rises. Then there is the Israel/Lebanon/Hezbollah war. Israel and Lebanon talk ceasefire, but Hezbollah does not appear to be a part of it.
A record low for the Michigan Sentiment Index left gold unmoved, although Friday was an up day for gold. Gold was also unmoved by the possibility the next Fed chairman will be Kevin Warsh. Given rising inflation, it will be difficult for any Fed chair to cut interest rates. Nonetheless, gold and silver and the gold stocks (HUI, TGD) seem to be caught betwixt and between. It’s no surprise that the RSI is neutral. So, despite the ups and downs of the past two months, we are essentially going nowhere. We await breakouts. That means gold above $5,100 for starters, silver above $90, and the TGD above 1,000. Preferable is gold above $5,400 and silver above $96. In the interim, pullbacks must see gold hold above $4,200 and silver above $60/$65.
This has been a tough time to be a gold bug. But as the gold bugs know, we’ve been through this before. Many are pointing to $6,000 gold, even up to $10,000. They may eventually be proven correct just as targets of $5,000 proved correct. But in the interim their dreams are on hold. That said, all conditions point to higher prices. Typically, we see lows for gold in June/July. Gold bugs will have to be patient.
Source: www.goldchartsrus.com
Source: www.stockcharts.com
Oil and gas
Source: www.stockcharts.com
Once again, it is a whipsaw market for oil as the previous week’s big drop was reversed this past week. WTI oil jumped 11.7% while Brent crude soared over $100 once again, up 17.3%. Oil is event-driven. Peace in our time: oil falls. The war is still on: oil rises. Yes, they announced an extension of the ceasefire, but the U.S. blockade of the Strait of Hormuz remains as does the Iranian blockade. Each blockade has a different effect on shipping, but the reality is, barely anything is moving through the Strait. And, as many have noted, that is a big problem for the world. If there was a hopeful note, Iran announced that its foreign minister was on his way to Islamabad for talks with the U.S. Whether it amounts to anything is anybody’s guess as the two remain so far apart. Then just as fast as it was announced both Iran and the U.S. were going to Islamabad, both ditched the idea and won’t be meeting. War on? Both sides have seized ships in the strait and even outside the strait. At least diplomacy is giving us some hope. But in reality, don’t count on it.
The world, meanwhile, sits on the edge as we know the worst is yet to come. Natural gas (NG) was mixed with NG at the Henry Hub, off 6% to new 52-week lows while NG at the EU Dutch Hub rose 14.1%. The EU is more negatively impacted by the ongoing blockades. Energy stocks did rise with the ARCA Oil & Gas Index (XOI) up 4.7% and the TSX Energy Index (TEN) up 4.4%. It continues to be a good time to own energy stocks.
As we have noted, WTI oil may be forming a symmetrical triangle. This should break to the upside. If we get back over $100 then we are probably headed higher. A breakdown under $92.50 could signal lower. But even if this ended tomorrow, we would not see a significant drop in the price of oil. Welcome to the new reality.
Markets and trends follow
Markets and Trends
|
|
|
|
% Gains (Losses) Trends |
|
||||
|
|
Close Dec 31/25 |
Close Apr 24/26 |
Week |
YTD |
Daily (Short Term) |
Weekly (Intermediate) |
Monthly (Long Term) |
|
|
|
|
|
|
|
|
|
||
|
S&P 500 |
6,845.50 |
7,165.08 (new highs) * |
0.6% |
4.7% |
up |
Up |
up |
|
|
Dow Jones Industrials |
48,063.29 |
49,230.71 |
(0.4)% |
2.4% |
up |
up |
up |
|
|
Dow Jones Transport |
17,357.19 |
20,891.08 (new highs) * |
(6.8)% |
20.4% |
up |
up |
up |
|
|
NASDAQ |
23,241.99 |
24,836.38 (new highs) * |
1.5% |
6.9% |
up |
up |
up |
|
|
S&P/TSX Composite |
31,712.76 |
33,904.11 |
(1.3)% |
6.9% |
up |
up |
up |
|
|
S&P/TSX Venture (CDNX) |
987.74 |
1,011.00 |
(4.2)% |
2.4% |
up |
up |
up |
|
|
S&P 600 (small) |
1,467.76 |
1,659.19 (new highs) * |
0.7% |
13.0% |
up |
up |
up |
|
|
ACWX MSCI World x US |
67.18 |
73.71 |
(1.6)% |
9.1% |
up |
up |
up |
|
|
Bitcoin |
87,576.98 |
77,569.32 |
0.1% |
(11.4)% |
up |
down |
neutral |
|
|
|
|
|
|
|
|
|
|
|
|
Gold Mining Stock Indices |
|
|
|
|
|
|
|
|
|
Gold Bugs Index (HUI) |
701.49 |
801.87 |
(6.3)% |
14.3% |
neutral |
up |
up |
|
|
TSX Gold Index (TGD) |
817.76 |
917.76 |
(6.1)% |
12.2% |
neutral |
up |
up |
|
|
|
|
|
|
|
|
|
|
|
|
Bonds% |
|
|
|
|
|
|
|
|
|
U.S. 10-Year Treasury Bond yield |
4.17% |
4.31% |
1.4% |
3.4% |
|
|
|
|
|
3.3Cdn. 10-Year Bond CGB yield |
3.44% |
3.46% |
0.3% |
0.6% |
|
|
|
|
|
Recession Watch Spreads |
|
|
|
|
|
|
|
|
|
U.S. 2-year 10-year Treasury spread |
0.69% |
0.52% |
(3.7)% |
(24.6)% |
|
|
|
|
|
Cdn 2-year 10-year CGB spread |
0.85% |
0.64% |
(1.5)% |
(24.7)% |
|
|
|
|
|
|
|
|
|
|
|
|
|
|
|
Currencies |
|
|
|
|
|
|
|
|
|
US$ Index |
98.26 |
98.52 |
0.4% |
0.3% |
down |
neutral |
down |
|
|
Canadian $ |
72.87 |
73.17 |
0.1% |
0.4% |
up (weak) |
up |
neutral |
|
|
Euro |
117.48 |
117.19 |
(0.4)% |
(0.3)% |
up |
up |
up |
|
|
Swiss Franc |
126.21 |
127.41 |
(0.5)% |
1.0% |
neutral |
up |
up |
|
|
British Pound |
134.78 |
135.30 |
0.1% |
0.4% |
up |
up |
up |
|
|
Japanese Yen |
63.83 |
62.73 |
(0.5)% |
(1.7)% |
down |
down |
down |
|
|
|
|
|
|
|
|
|
|
|
|
Precious Metals |
|
|
|
|
|
|
|
|
|
Gold |
4,311.97 |
4,708.46 |
(2.9)% |
9.2% |
down (weak) |
up |
up |
|
|
Silver |
71.16 |
75.85 |
(6.6)% |
6.6% |
down (weak) |
up |
up |
|
|
Platinum |
124.81 |
2,019.20 |
(4.7)% |
(1.4)% |
down (weak) |
neutral |
up |
|
|
|
|
|
|
|
|
|
|
|
|
Base Metals |
|
|
|
|
|
|
|
|
|
Palladium |
1,619.50 |
1,505.50 |
(4.5)% |
(7.0)% |
down (weak) |
neutral |
up |
|
|
Copper |
5.64 |
6.03 |
(0.8)% |
6.9% |
up |
up |
up |
|
|
|
|
|
|
|
|
|
|
|
|
Energy |
|
|
|
|
|
|
|
|
|
WTI Oil |
57.44 |
95.17 |
11.7% |
65.7% |
up |
up |
up |
|
|
Nat Gas |
3.71 |
2.52 (new lows) |
(6.0)% |
(32.1)% |
down |
down |
down (weak) |
|
Source: www.stockcharts.com
* New All-Time Highs
Note: For an explanation of the trends, see the glossary at the end of this article.
New highs/lows refer to new 52-week highs/lows and, in some cases, all-time highs.
Copyright David Chapman 2026
GLOSSARY
Trends
Daily – Short-term trend (For swing traders)
Weekly – Intermediate-term trend (For long-term trend followers)
Monthly – Long-term secular trend (For long-term trend followers)
Up – The trend is up.
Down – The trend is down
Neutral – Indicators are mostly neutral. A trend change might be in the offing.
Weak – The trend is still up or down but it is weakening. It is also a sign that the trend might change.
Topping – Indicators are suggesting that while the trend remains up there are considerable signs that suggest that the market is topping.
Bottoming – Indicators are suggesting that while the trend is down there are considerable signs that suggest that the market is bottoming.
Disclaimer
David Chapman is not a registered advisory service and is not an exempt market dealer (EMD) nor a licensed financial advisor. He does not and cannot give individualised market advice. David Chapman has worked in the financial industry for over 40 years including large financial corporations, banks, and investment dealers. The information in this newsletter is intended only for informational and educational purposes. It should not be construed as an offer, a solicitation of an offer or sale of any security. Every effort is made to provide accurate and complete information. However, we cannot guarantee that there will be no errors. We make no claims, promises or guarantees about the accuracy, completeness, or adequacy of the contents of this commentary and expressly disclaim liability for errors and omissions in the contents of this commentary. David Chapman will always use his best efforts to ensure the accuracy and timeliness of all information. The reader assumes all risk when trading in securities and David Chapman advises consulting a licensed professional financial advisor or portfolio manager such as Enriched Investing Incorporated before proceeding with any trade or idea presented in this newsletter. David Chapman may own shares in companies mentioned in this newsletter. Before making an investment, prospective investors should review each security’s offering documents which summarize the objectives, fees, expenses and associated risks. Although Artificial Intelligence (AI) may be deployed from time to time, AI output is monitored and adjusted, if necessary, for accuracy. David Chapman shares his ideas and opinions for informational and educational purposes only and expects the reader to perform due diligence before considering a position in any security. That includes consulting with your own licensed professional financial advisor such as Enriched Investing Incorporated. Performance is not guaranteed, values change frequently, and past performance may not be repeated.
Read the full article here