

“Can I start, mmb?”
Yes, Squire, you “may” start.
“Oops, sorry, mmb. But you always say the S&P is gonna crack, but usually it just makes new highs!”
We openly stand guilty as charged, Squire, albeit when it all goes wrong, ’twill be massive … and it may ~finally~ have just commenced. More on that later as first let’s get to Gold, the price track for which since the All-Time-High (5586 on 29 January) remains net-negative on both a medium-term basis as well as near-term.
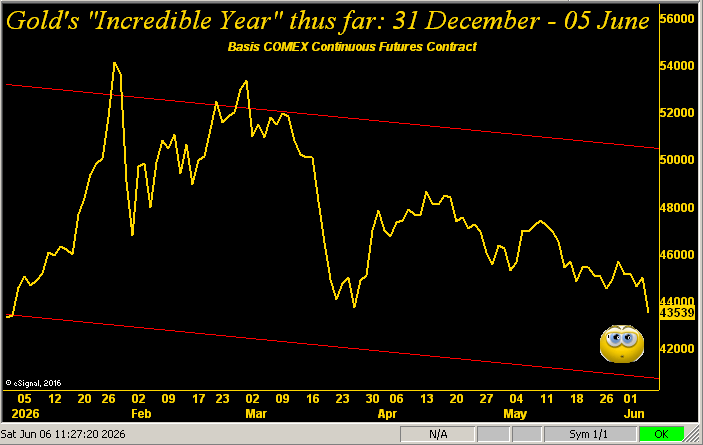
In settling this past week yesterday (Friday) at 4354, Gold recorded its fifth down week in the last seven, indeed its lowest weekly close since the parabolic Short trend became effective upon opening at 4450 back on 23 March, nonetheless en route having traded to as high as 4918 on 17 April … (but ’twas not enough to flip the trend back to Long). Rather, the Short trend continues with price itself now -22.1% below that 5586 record high, and more starkly, only up a wee +0.5% year-to-date.
But to quickly double check that, what does “AI” (“Assembled Inaccuracy”) say at this very moment (05:54 GMT)?
Query: “Is Gold having a good year?”
Response: “Gold is having another incredible year. Building on historic 2025 highs, prices briefly soared past $5,000 per troy ounce early this year. While prices have dipped slightly to the $4,350 range…”
Thus by “AI“, Gold’s gain of +0.5% is “incredible” albeit the -22.1% decline is characterized as having “dipped slightly”. Hilarious. Perhaps “AI” ought instead stand for “Avoid Inperpetuum”, (a little Latin lingo there). That pondered, this is Gold’s “incredible year” here by its daily settles from 31 December through yesterday 05 June, replete with the red-bounded, negative regression channel:
“But what’s really incredible are your high and low calls, mmb…”
Thank you, Squire, yet we’ve still better than half-a-year to go. However to your point, in this year’s opening missive we projected 5546 for the year’s high (actual-to-date 5586) and 4032 for the year’s low (actual-to-date 4000). But let us not digress…
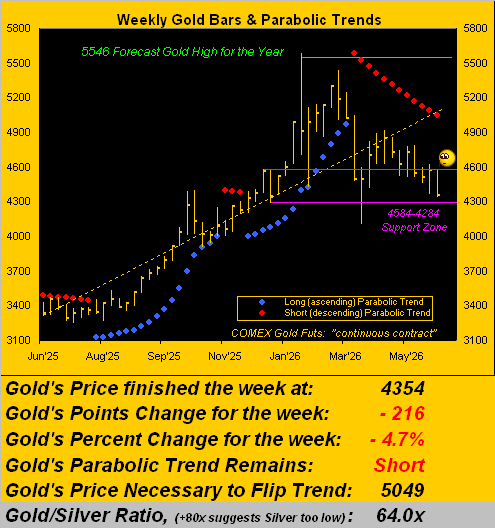
Instead, we go to Gold’s weekly bars from one year ago-to-date, the aforementioned rightmost red-dotted parabolic Short trend having just completed its 12th week. We’ve again depicted the 4584-4284 support zone wherein Gold of late has been making a home:
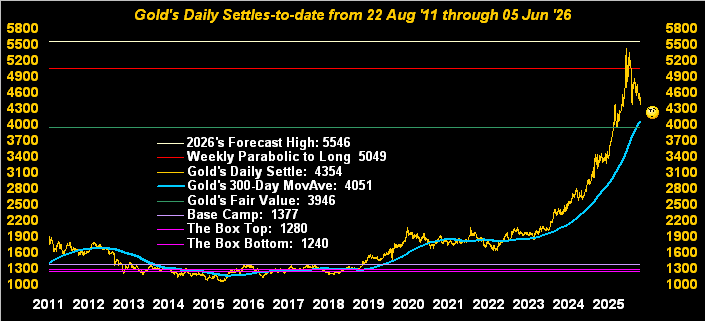
More broadly, here’s our long-featured chart of Gold by the day from what had been a record closing high at 1900 away back on 22 August 2011. Price naturally has moved quite a distance higher following all those annoying years of being infamously stuck in and around “The Box”. But today we’ve this question, courtesy of our ever-savvy “Means Reversion Dept.”: is Gold (now 4354) targeting its once stalwart 300-day moving average (4051), and further its Fair Value (3946, as shown in the opening Scoreboard)? Given Gold’s expected weekly trading range is now 296 points, both those levels are well within reach by month’s end, barring Gold getting back into rally mode:
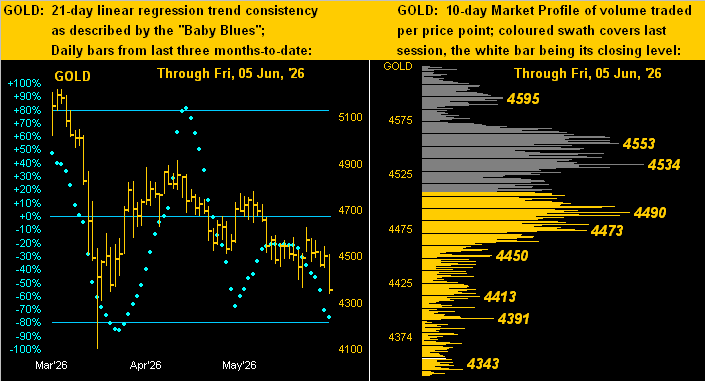
And for Gold to resume rallying, there is a substantive amount of overhead drilling to do per the 10-day Market Profile below on the right, volume-dominant resistance running from 4473 up toward 4553 as labeled. Then for Gold’s 21-day linear regression trend, its day-to-day consistency is depicted by the three months of baby blue dots on the left, wherein the farther they fall, the steeper the downtrend that in due course shall end; ’tis just a matter of “When?” We’ll know early on upon the “Baby Blues” making their inevitable bend:
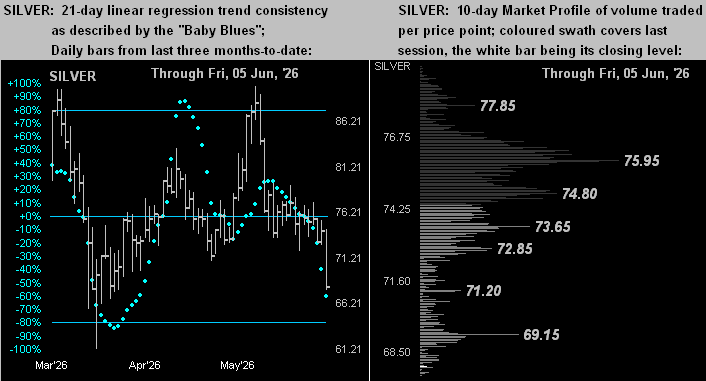
Similarly for Silver, she’s basically buried at the base of her Profile (below right) with various resistors from here (68.00) all the way up to 75.95; too, her “Baby Blues” (below left) are in full cascade, the recent downtrend gathering steam. Jam on the brakes, Sister Silver!
Now as we glide toward a feasibly frightening fate for the S&P 500, let’s start with the Economic Barometer. This past week’s set of 13 incoming metrics brought improvements for Factory Orders, along with both of the Institute for Supply Management’s gauges of Manufacturing and Services, plus Construction Spending and Employment.
In that construct, things are sufficiently good StateSide that we again are reminded of the famous quip by the late great Senator Ernest Frederick “Fritz” Hollings (D-SC): “There’s too much consumin’ goin’ on out there!”
Although that stated, Fritzie, there was slowing in Consumer Credit, Productivity and Unit Labor Costs, plus an increase in Initial Jobless Claims. Add in the irksome inflation as we herein nauseatingly detailed a week ago and that elicits a Federal Reserve Funds rate increase: we still think the “ever behind the curve” Open Market Committee shall sit on their hands per their 17 June Policy Statement, such hands then being forced to raise come the 29 July Statement. The Dollar Index certainly so senses that, the “Dixie” trading yesterday up to its highest level since 06 April (100.095). So also senses the shaken S&P as we go to the Baro:
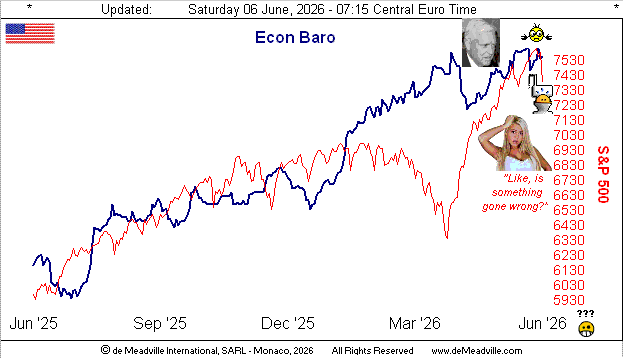
And thus we (again) ask: “How’s that S&P 500 workin’ out for ya?”
Truth be told, we’d already selected this week’s title to include “S&P Poised to Crack” well before it began to all go wrong yesterday, given what we’d written in Thursday’s pre-opening Prescient Commentary as regards the “Spoo”, (which is the pet name for the S&P 500’s futures contract):
- “…the Spoo’s ‘Baby Blues’ which depict linreg consistency are finally breaking down, now provisionally below the key +80% axis; should this be confirmed by session’s end, we’d expect at least initially a drop from here (7544) toward the mid-7400s — which percentage-wise is not that substantive a pullback — but by pricing structure, 7300 appears plausible as does 7279 given the extreme overvaluation of the S&P 500 both technically and obviously fundamentally…”
Accordingly, two trading days hence, the S&P has fallen from the fence to further commence (we sense) a far broader descent. Regulars readers know the the S&P continues to be rife with negatives to cause a “correction”. Even through yesterday — the S&P’s worst one-day decline so far this year (-2.6%) — the Index nevertheless recorded a 41st consecutive “textbook overbought” session, something that has occurred but 13 other times across the past 46 years, (which for you WestPalmBeachers down there is since 1980).
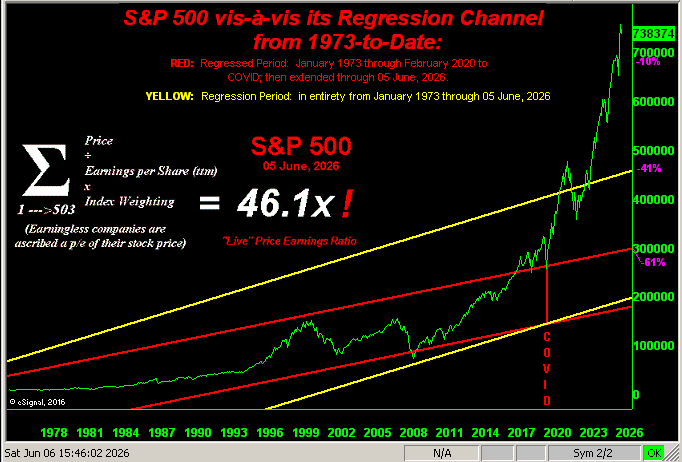
Too, of greater concern is the “live” (trailing twelve months) price/earnings ratio of now 46.1x. Back when earnings were actually considered a core element in portfolio theory for valuing share prices, 11x to 15x was considered “acceptable” for a bull market. Reverting to that “mean” means a “correction” from here of -67% … just in case you’re scoring at home. Or more modestly, for the S&P to merely return from its 03 June record high (7620) to the upper boundary of its 54-year regression channel (4505), ’tis only a “correction” of -41%. Still, “had COVID never happened”, the S&P today could well be ’round 2941 (i.e. a “correction” of minimally -61%).
‘Course, no one knows if we’re now on the precipice of a material S&P “correction” such has already twice occurred this century, the first being the “DotComBomb” (-50.5%) and the second the “FinCrisis” (-57.7%). But we expect whenever this next “Look Ma! No Money!” “correction” eventuates, the fear shall drive the S&P well down below -50%. Remember, today’s average investment bank youngster has never endured the violence of a true stock market crash; (2020’s four-day -35% COVID “mini-crash” was peanuts).
“But what about for this time, mmb?”
Squire, conservatively -10% to 6858, which is a very convenient rest stop, because the perfect “Golden Ratio” Fibonacci retracement from the record high (7620) toward the 30 March low (6317) arrives quite close by at 6816. Nice and tidy, what? Here’s the all-encompassing Big Picture S&P graphic, a few noted percentage “correction” suggestions along the right-side scale:
Wrapping it for Gold, clearly the yellow metal has been riding on its net-negative track, even as price by the opening Scoreboard is +10.3% above Fair Value (3946), yet -6.2% below its BEGOS* Market Value (4640) to which typically it can more swiftly ascend as ’tis a “faster” valuation measure.
*BEGOS = Bond / Euro / Gold / Oil / S&P 500
As for the suddenly struggling (albeit long overdue) S&P, we’ll leave you with this:
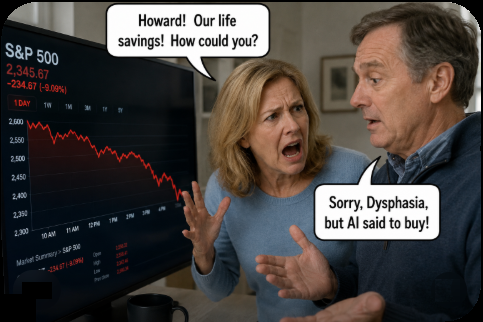
“Got Gold?”
Cheers!
…m…
www.TheGoldUpdate.com
www.deMeadville.com
and now on “X”: @deMeadvillePro
deMeadville. Copyright Ⓒ 2010 – 2026. All Rights Reserved
Read the full article here