

Silver remains a topic of interest for the market given its wipe-out the previous week. Bull market to a bear market in a nano-second. Will it recover? Probably yes, but it may take a while. In the interim, that high of $121.67 will probably stand for some time. Crashes like this are not overcome in a few days. Thus far, the low has been $63.99. But could we still head for a test of the major breakout level of $50? Yes.
Silver fell on the week, but gold and gold stocks were up. Endeavour Mining PLC, for example, a senior gold producer, reported strong free cash flow, reduced debt, a record dividend, and is held in the Enriched Capital Conservative Growth Strategy.* And so incidentally was the Global X Silver Miners (SIL). A potential positive divergence? Also by week’s end, silver made new lows for this move while gold did not. Another potential positive divergence?
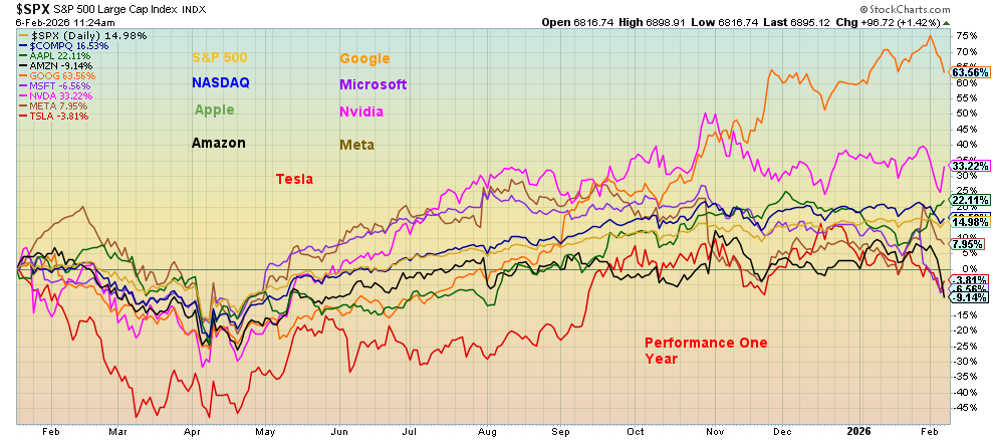
Stocks were a mixed bag this week as well, with the DJI setting another record high, as did the DJT. But both the S&P 500 and the NASDAQ closed down for the week. Six of the seven MAG7 were down on the week. Is the AI bull over? No breakdown yet, but we note the breakdown points for the S&P 500. Movement was sluggish for the currencies and long-term interest rates.
The U.S. job numbers were out this week. Well, no, they weren’t because of a government shutdown. They are expected on Feb 11 (we hope). Canada released its January numbers, and it was a mixed bag with job losses but also a drop in the unemployment rate. Our markets and trends are there as usual at the end.
This week is a shortened report as we are away most of the weekend. This coming week, we will be travelling to Victoria, B.C. We hope to get at least a shortened report out next weekend.
The weather is a lot warmer in Victoria. Not so much here. Some of our windows are frosted over.
Have a great week! Stay warm!
DC
* Reference to the Enriched Capital Conservative Growth Strategy and its investments, celebrating a 7.92 -year history of 147.47% growth (annual 12.13%), is added by Margaret Samuel, President, CEO and Portfolio Manager of Enriched Investing Incorporated, who can be reached at 416-203-3028 or [email protected] This information should not be construed as an offer, or a solicitation of an offer or sale of any security. Past performance does not guarantee future returns
“If investing is entertaining, if you’re having fun, you’re probably not making any money. Good investing is boring.”
—George Soros, Hungarian-American investor, philanthropist, established the hedge fund The Quantum Fund, known as the man who broke the Bank of England (1992), through various foundations known for his philanthropy and progressive and liberal causes, which brings him the ire of right-wing conspiracy theorists; b. 1930
“The reason that ‘guru’ is such a popular word is because ‘charlatan’ is so hard to spell.”
—Barry Ritholtz, American businessman, author, CIO Ritholtz Wealth Management, author of Bailout Nation: How Greed and Easy Money Corrupted Wall Street and Shook the World Economy (2009); b. 1961
“There have been three great inventions since the beginning of time: fire, the wheel, and central banking.”
—Will Rogers, American vaudeville performer, actor, humorous social commentator, mayor of Beverly Hills (1926), wrote numerous newspaper columns, acted in 71 films (50 silents, 21 talkies), died at 56 in an airplane crash; 1879–1935
Gold and Silver
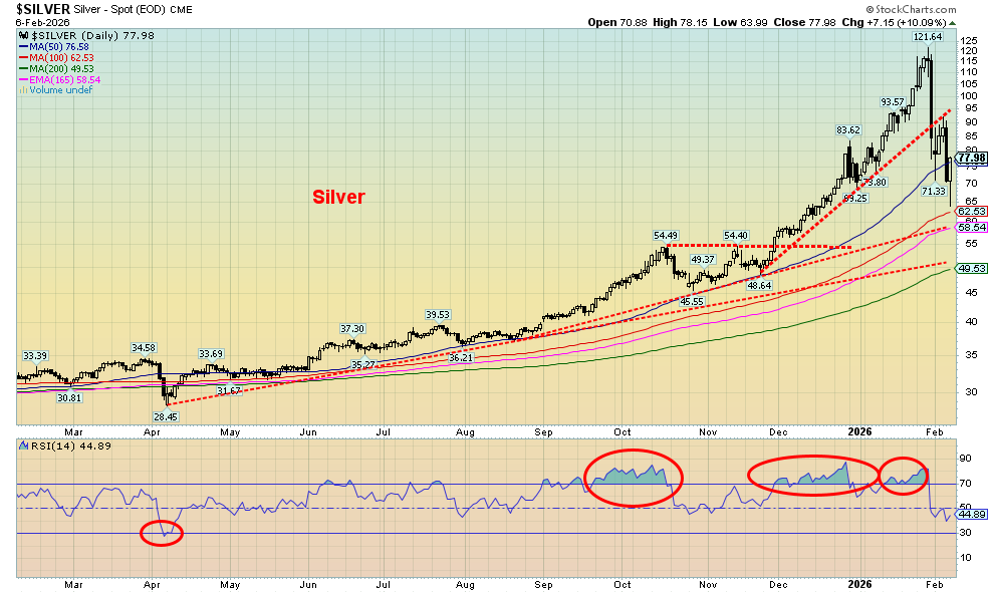
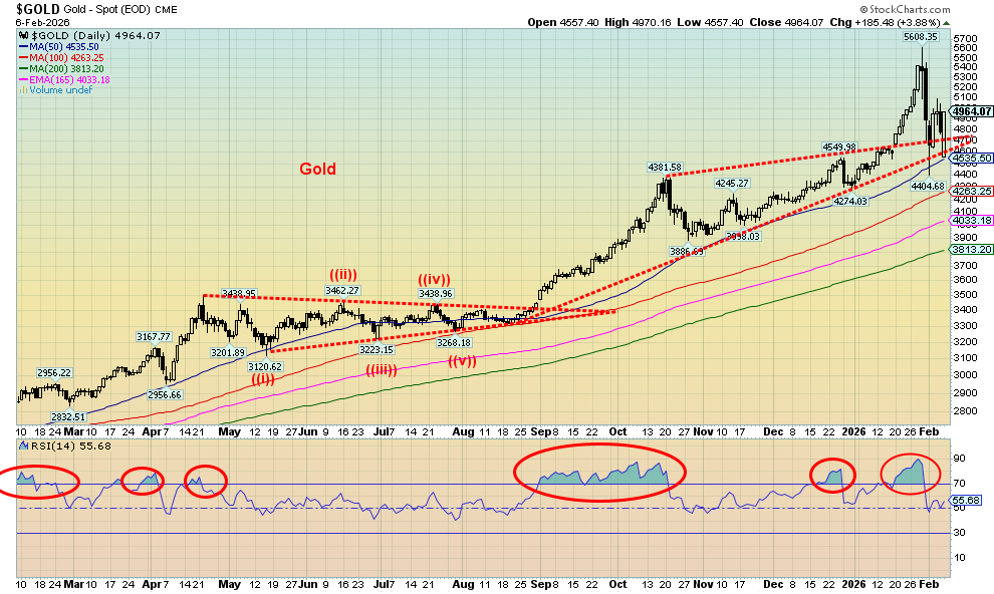
Much has been written about the silver slaughter of January 30, 2026. That day, silver fell a mind-boggling 27%. Altogether, the decline from top to bottom (to date) was 41.4%. In a nanosecond, silver went from a bull market to a bear market with nothing in between. Gold was hit as well, but to date, its decline is only 21.5%. That’s also a bear market. The change from bull to bear was as dramatic as anything we’ve ever seen.
There were the triggers. The Chicago Mercantile Exchange (CME) changed margin requirements again, catching many offside and facing margin calls. Forced selling, stop-loss selling, and evidence that the bullion banks piled on as they were short exacerbated the decline. Bond yields were sticky to the upside, especially in Japan, the U.S. dollar strengthened off recent lows, and trading was thin with buyers quickly dropping bids. This was, as many noted, a technical crash, not a fundamental one. Physical tightness remains: mine supply remains down while demand is high, particularly for industrial use. Silver is being named as a critical metal. Spreads between paper silver and physical silver widened. Paper silver outnumbers physical silver by an estimated margin of 350:1. Some say it’s even higher.
Nonetheless, crashes like this are not finished in a day or two. Typically, they could last for days, weeks, or even months before we begin the next leg up. It could also be a corrective wave up. That high of $121.64 could be it for some time. Not until we make new highs could we call this bear market truly over. At this time, we’d have to take out $110 just to suggest possible new highs ahead. Silver hit new lows. Gold did not. A divergence? We consider $70 support for silver. If that breaks, the next good support doesn’t come in until around $55. A test of the major $50 breakout? Yes, that is possible.
Given the big drop for gold and silver, one would expect the gold stocks to have been slaughtered. The TSX Gold Index (TGD) fell 17%, the Gold Bugs Index (HUI) dropped 18.7%, the Van Eck Gold Miners ETF (GDX) fell about 19%, the Van Eck Junior Gold Miners ETF (GDXJ) fell 20.6%, and the Global X Silver Miners ETF (SIL) fell 23.4%.
What gives? Silver gets slaughtered 41%, but the Silver Gold Miners (SIL) falls only 23.4%? Aren’t the stocks (paper) supposed to outperform both the upside and downside? Maybe the gold and silver stocks didn’t believe the drop in the metals. Granted, on the other side, silver had gained 390% from 2024 to the recent peak vs. a gain for SIL of only 318%. But gold gained 163% while the GDX was up 269% and GDXJ was up 316%. Spectacular gains for all. But it was only silver that outperformed everyone, primarily because of shortages and demand for physical silver.
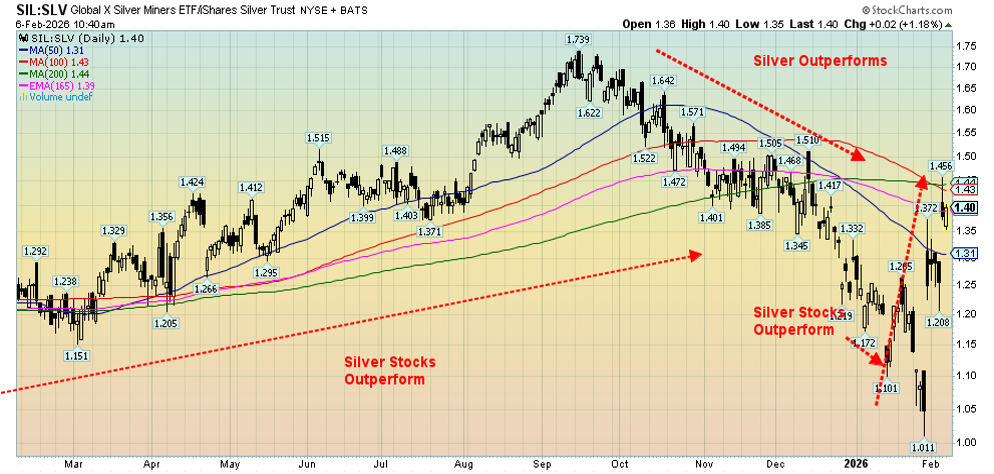
An interesting way to look at this is a ratio chart. In this chart, we show the Silver Miners (SIL) to the Silver Trust (SLV) ratio going back to 2011.
Global Silver Miners (SIL)/iShares Silver Trust (SLV) Ratio 2011–2026
Source: www.stockcharts.com
During this period, silver outperformed in bear or down markets while the silver stocks outperformed in bull up markets. The ratio peaked in September 2025 at 1.74, and from September to January 29, 2026, silver was outperforming the silver stocks. But the crash on January 30, 2026, changed everything. Since then, the ratio has climbed back up to 1.38, indicating that since the crash, the stocks have been outperforming.
We view the silver stocks hanging in this well against the silver price as positive going forward. But as indicated, this corrective period could last days, weeks, or longer. The fundamentals remain the same as they were when we rose from $21.91 low in early 2024 to the $121.63 peak.
Source: www.stockcharts.com
Silver has good support down to $58/$62 if the recent low at $71.33 fails. What really caught our eye is that since that high on January 29 (low for the SIL/SLV ratio), the silver stocks caught a bid even as silver itself was plunging. We took the same SIL/SLV chart and shortened the time frame to show how silver stocks outperformed from January 30. A positive divergence indicates that maybe this massive sell-off won’t last too long. Needless to say, the sell-off isn’t over until gold, silver, gold, and silver stocks are making new highs together. Anything else should be viewed with some suspicion.
The bull market for gold, silver, the gold/silver stocks, many other precious metals, and even near precious metals this past year or so has been nothing short of spectacular. As we’ve so often noted, they are rising because of geopolitical concerns, domestic (U.S.) political concerns, massive amounts of debt everywhere that are threatening a sovereign debt crisis, and sticky interest rates, particularly at the long end of the yield curve that remains above what we had become accustomed to. The Fed can cut rates all they want, but it’s the bond market that rules.
We live in dangerous times.
Source: www.stockcharts.com
Source: www.stockcharts.com
Stocks
Source: www.stockcharts.com
Is the stock market breaking down? Many will be asking that question, just as many may be busy buying the dip as they have done constantly over the past few years since the current bull got underway, after the 2022 inflation low. After all, companies are still reporting good earnings. Indeed, earnings have hit record levels. Some have even raised their dividends. The stock market has been favoured with falling interest rates, and the Fed is stimulating again as they buy up $40 billion monthly from the banks and others, thus putting oodles of money back into the financial system. Yes, M1 has been expanding, as is the Fed balance sheet. Sharply rising P/E multiples, record price to sales, record price to book – we could go on. Money in the pockets of the banks, dealers, and hedge fund managers is magic for the stock market. The rest is just noise. Until it isn’t. No, this time is not different.
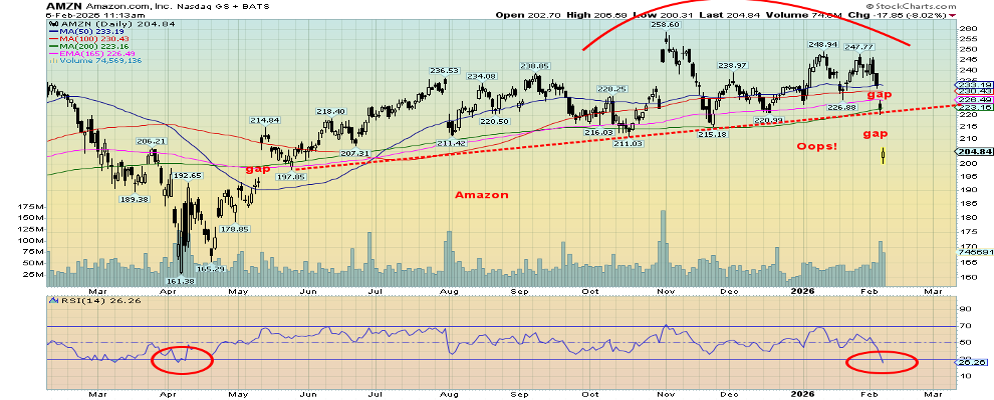
Amazon has been one of the poster children for the MAG7. Amazon’s CEO, Jeff Bezos, is also a favourite of President Trump. But is Amazon’s party over? Those gaps down look like a serious “oopsy.” If Amazon has problems, the other MAG7 stocks could follow. Google has been the big star, but we note that besides Amazon, Microsoft, and Tesla are now down on the year. Nothing magnificent about them. Some of the others are rolling over. The MAG7 led the way up. Could they lead the way down? This past week alone saw six of the MAG7 down on the week, with only Apple up.
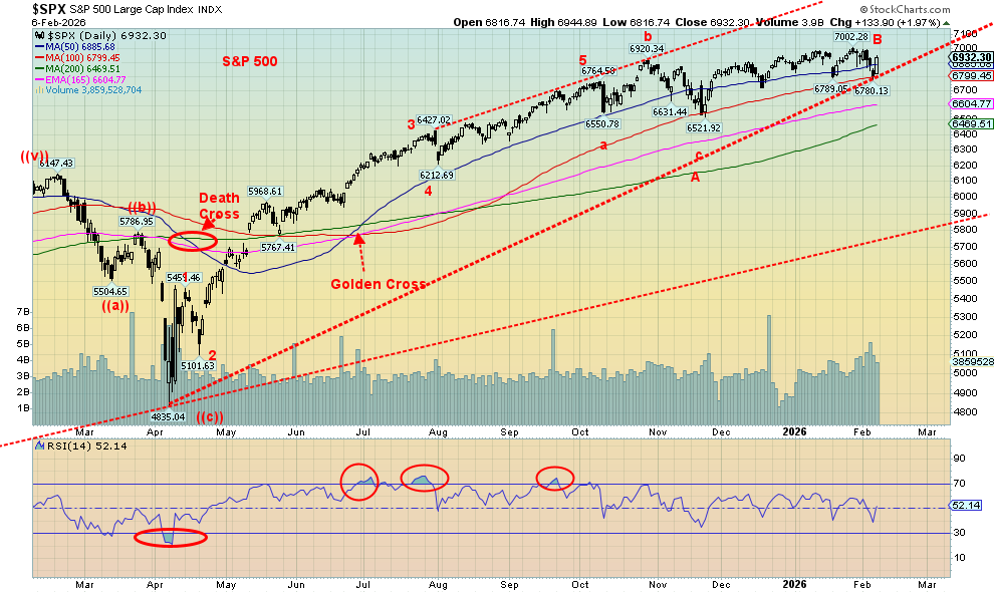
The market has looked toppy for some time. The indices appear to be poised to fall. That alone does not make a bear market. That 6,500 zone for the S&P 500 remains key. If it breaks, then there is trouble. Under 6,200, trouble really gets underway. Complacency is not an option. Consumer sentiment seems to get it, while the stock market still lives in nirvana – but for how much longer?
Source: www.stockcharts.com
Fed Balance Sheet and M1 2016-2026
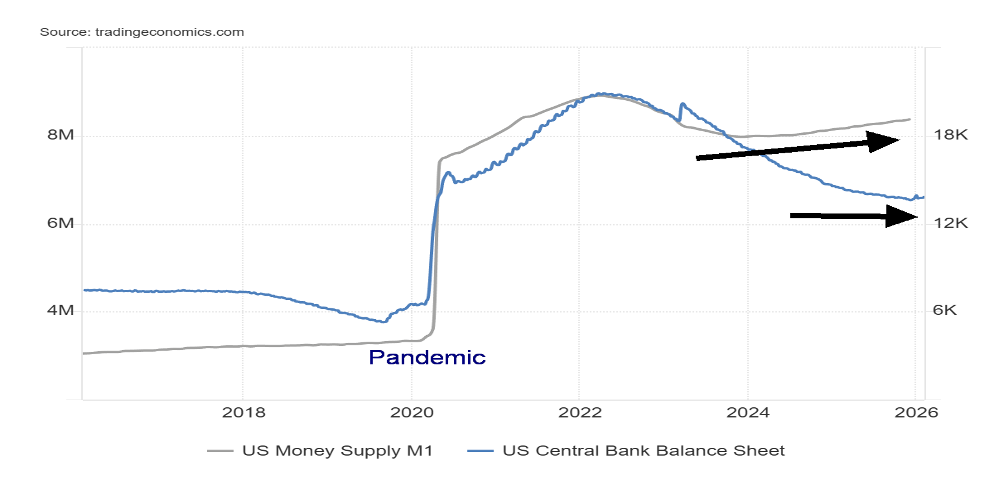
Source: www.tradingeconomics.com, www.federalreserve.gov
Source: www.stockcharts.com
If there was any room for optimism, we can’t help but note that both the Dow Jones Industrials (DJI) and the Dow Jones Transportation (DJT) not only finished the week up but also made all-time highs. On Friday, the DJI was up a spectacular 1,200 points, crossing and closing over 50,000 for the first time ever. Others also joined the party with the NYSE, the Dow Jones Composite (DJC), the S&P 400 (Mid), and the S&P 600 (Small) all making new all-time highs. Notably, the Russell indices (1000, 2000, 3000) nor the Wilshire 5000 did not join the party. DJI, DJT all rising, making new highs together? Dow Theory says the indices must confirm each other. They did. So are we topping, or just another pause?
US Job Numbers
What job numbers? Once again, due to a government shutdown, the U.S. job numbers were not released on February 6, 2026, as originally planned. Instead, they are coming out on February 11, 2026 (we hope). In the interim, all we have are the ADP employment change report and Challenger Job Cuts.
U.S. ADP Employment Change, Challenger Job Cuts 2021–2026
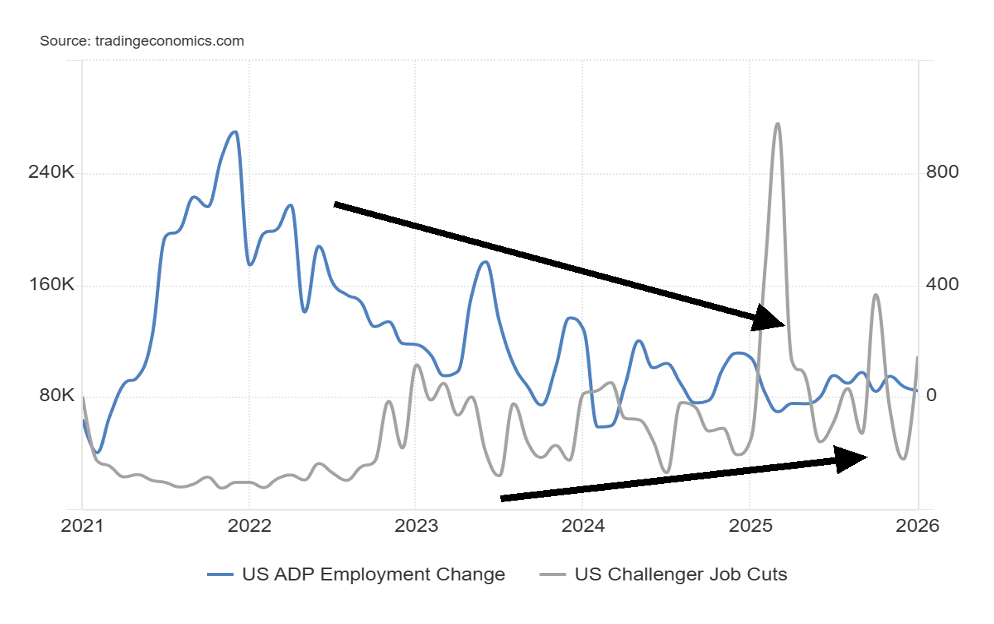
Source: www.tradingeconomics.com, www.adpemploymentreport.com, www.challengergray.com
The ADP National Employment Report is an independent measure of the labour market, based on the anonymized weekly payroll data of more than 26 million private-sector employees in the United States. ADP’s Pay Insights captures over 15 million individual pay change observations each month.
The ADP report for January came in at 22,000, below December’s 37,000 and below the expected 35,000–48,000.
Challenger job cuts are based on U.S. employers’ reports of hiring.
Challenger job cuts for January came in at 108,435, well above the previous 35,553 and above the consensus of 43,000. Challenger Job Cuts have been rising while ADP employment change has been falling, suggesting a potentially weak nonfarm payroll, which we hope to get next week.
Canada Job Numbers
Canada Job Numbers and Unemployment Rate 2021-2026
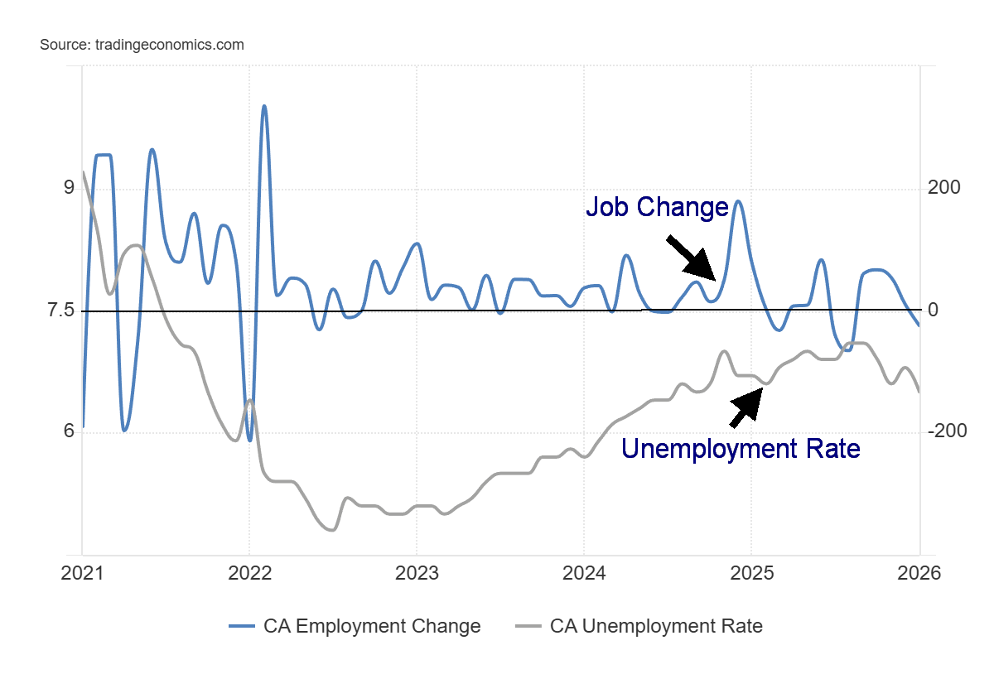
Source: www.tradingeconomics.com, www.statcan.gc.ca
Employment in Canada fell by some 24,800 in January 2026. That followed a 10,100 gain in December and expectations of a gain of 7,000. The unemployment rate fell to 6.5% from 6.8%. Not so good the job losses, but the unemployment rate fell. The good news is that full-time employment increased by 44,900 while part-time employment fell by 69,700. While the drop in the unemployment rate was touted, it also highlighted that fewer people were actively looking for work. We note as well that population levels have also decreased over the past few months due to the loss of non-permanent residents, international students, and temporary foreign workers, all or at least some of whom might have been considered a part of the labour force. There has also been a rise in workers 65 years and older and an increase in retirees, none of whom would now be considered a part of the labour force.
The labour force participation rate fell to 65.0% from 65.4%, while the employment population ratio dropped to 60.8 from 60.9. Fewer people in the labour force helps lower the unemployment rate. Manufacturing losses were the largest factor (Ontario auto industry – thanks to tariffs), but Canada also saw job losses in education and public administration. Alberta fared the best and Ontario the worst. Best gains were seen in information, culture and recreation.
The question now is, will this spark the Bank of Canada (BofC) to lower interest rates further? The next interest rate decision is not due until March 18. Many are betting that the BofC’s hands may be tied going forward, depending on what the Fed might do and still sticky inflation. The current situation certainly would not justify the BofC’s rate, which was during the pandemic 2020-2022.
The employment report was a very mixed bag, and a few data pieces were not yet available.
Markets and Trends
|
|
|
|
% Gains (Losses) Trends |
|
||||
|
|
Close Dec 31/25 |
Close Feb 6/26 |
Week |
YTD |
Daily (Short Term) |
Weekly (Intermediate) |
Monthly (Long Term) |
|
|
|
|
|
|
|
|
|
||
|
S&P 500 |
6,845.50 |
6,932.30 |
(0.1)% |
1.3% |
up |
up |
up |
|
|
Dow Jones Industrials |
48,063.29 |
50,115.67 (new highs) * |
2.5% |
4.3% |
up |
up |
up |
|
|
Dow Jones Transport |
17,357.19 |
19,892.36 (new highs) * |
8.7% |
14.6% |
up |
up |
up |
|
|
NASDAQ |
23,241.99 |
23,031.21 |
(1.8)% |
(0.9)% |
up |
up |
up |
|
|
S&P/TSX Composite |
31,712.76 |
32,470.98 |
1.7% |
2.4% |
up |
up |
up |
|
|
S&P/TSX Venture (CDNX) |
987.74 |
1,015.34 |
(3.4)% |
2.8% |
up |
up |
up |
|
|
S&P 600 (small) |
1,467.76 |
1,610.32 (new highs) * |
4.0% |
9.7% |
up |
up |
up |
|
|
ACWX MSCI World x US |
67.18 |
72.06 (new highs) * |
1.8% |
7.3% |
up |
up |
up |
|
|
Bitcoin |
87,576.98 |
70,045.02 |
(16.5)% |
(20.0)% |
down |
down |
neutral |
|
|
|
|
|
|
|
|
|
|
|
|
Gold Mining Stock Indices |
|
|
|
|
|
|
|
|
|
Gold Bugs Index (HUI) |
701.49 |
806.53 |
3.2% |
15.0% |
up (weak) |
up |
up |
|
|
TSX Gold Index (TGD) |
817.76 |
923.70 |
3.2% |
13.0% |
neutral |
up |
up |
|
|
|
|
|
|
|
|
|
|
|
|
% |
|
|
|
|
|
|
|
|
|
U.S. 10-Year Treasury Bond yield |
4.17% |
4.21% |
(0.9)% |
1.0% |
|
|
|
|
|
Cdn. 10-Year Bond CGB yield |
3.44% |
3.40% |
(0.6)% |
(1.2)% |
|
|
|
|
|
Recession Watch Spreads |
|
|
|
|
|
|
|
|
|
U.S. 2-year 10-year Treasury spread |
0.69% |
0.71% |
(1.4)% |
2.9% |
|
|
|
|
|
Cdn 2-year 10-year CGB spread |
0.85% |
0.85% |
(1.1)% |
flat |
|
|
|
|
|
|
|
|
|
|
|
|
|
|
|
Currencies |
|
|
|
|
|
|
|
|
|
US$ Index |
98.26 |
97.61 |
0.5% |
(0.7)% |
down (weak) |
down |
down |
|
|
Canadian $ |
72.87 |
0.7323 |
(0.3)% |
0.5% |
up |
up |
neutral |
|
|
Euro |
117.48 |
118.24 |
(0.2)% |
0.7% |
up |
up |
up |
|
|
Swiss Franc |
126.21 |
128.98 |
(0.3)% |
2.2% |
up |
up |
up |
|
|
British Pound |
134.78 |
136.20 |
(0.5)% |
1.1% |
up |
up |
up |
|
|
Japanese Yen |
63.83 |
63.65 |
(1.5)% |
(0.3)% |
down (weak) |
down |
down |
|
|
|
|
|
|
|
|
|
|
|
|
|
|
|
|
|
|
|
|
|
|
Precious Metals |
|
|
|
|
|
|
|
|
|
Gold |
4,311.97 |
4,954.68 |
2.1% |
14.9% |
up |
up |
up |
|
|
Silver |
71.16 |
77.52 |
(7.9)% |
8.9% |
down (weak) |
up |
up |
|
|
Platinum |
124.81 |
2,097.00 |
(2.1)% |
2.5% |
down (weak) |
up |
up |
|
|
|
|
|
|
|
|
|
|
|
|
Base Metals |
|
|
|
|
|
|
|
|
|
Palladium |
1,619.50 |
1,716.00 |
2.7% |
6.0% |
down (weak) |
up |
up |
|
|
Copper |
5.64 |
5.88 |
(1.0)% |
4.3% |
up (weak) |
up |
up |
|
|
|
|
|
|
|
|
|
|
|
|
Energy |
|
|
|
|
|
|
|
|
|
WTI Oil |
57.44 |
63.52 |
(3.4)% |
10.6% |
up |
up (weak) |
down |
|
|
Nat Gas |
3.71 |
3.41 |
(22.2)% |
(8.1)% |
down |
up |
up |
|
Source: www.stockcharts.com
* New All-Time Highs
Note: For an explanation of the trends, see the glossary at the end of this article.
New highs/lows refer to new 52-week highs/lows and, in some cases, all-time highs.
Copyright David Chapman 2026
GLOSSARY
Trends
Daily – Short-term trend (For swing traders)
Weekly – Intermediate-term trend (For long-term trend followers)
Monthly – Long-term secular trend (For long-term trend followers)
Up – The trend is up.
Down – The trend is down
Neutral – Indicators are mostly neutral. A trend change might be in the offing.
Weak – The trend is still up or down but it is weakening. It is also a sign that the trend might change.
Disclaimer
David Chapman is not a registered advisory service and is not an exempt market dealer (EMD) nor a licensed financial advisor. He does not and cannot give individualised market advice. David Chapman has worked in the financial industry for over 40 years including large financial corporations, banks, and investment dealers. The information in this newsletter is intended only for informational and educational purposes. It should not be construed as an offer, a solicitation of an offer or sale of any security. Every effort is made to provide accurate and complete information. However, we cannot guarantee that there will be no errors. We make no claims, promises or guarantees about the accuracy, completeness, or adequacy of the contents of this commentary and expressly disclaim liability for errors and omissions in the contents of this commentary. David Chapman will always use his best efforts to ensure the accuracy and timeliness of all information. The reader assumes all risk when trading in securities and David Chapman advises consulting a licensed professional financial advisor or portfolio manager such as Enriched Investing Incorporated before proceeding with any trade or idea presented in this newsletter. David Chapman may own shares in companies mentioned in this newsletter. Before making an investment, prospective investors should review each security’s offering documents which summarize the objectives, fees, expenses and associated risks. David Chapman shares his ideas and opinions for informational and educational purposes only and expects the reader to perform due diligence before considering a position in any security. That includes consulting with your own licensed professional financial advisor such as Enriched Investing Incorporated. Performance is not guaranteed, values change frequently, and past performance may not be repeated.
Read the full article here