

Another week, another week of chaos. An observation given the speed at which the Trump team has been bringing out the executive decrees and creating chaos everywhere suggests that this was most likely planned in advance. A neutered Congress and Senate has approved all his ministers. Government worker firings are suggesting that unemployment, always a lagging indicator, is poised to rise possibly quickly and sharply. An economic slowdown would also be underway even as inflation appears to be rising again. Stagflation? Trade wars remain a possibility.
The markets may finally be coming apart. Walmart guidance and very weak January retail sales cracked the market this past week. No, it still has not confirmed a top but the result is the breakdown points are looming below. The S&P 500 diverged with the rest of the market making (barely) all-time highs again.
The go-to safe haven remains gold that made record highs again this past week. The gold stocks, with exceptions, took it on the chin along with the stock market. Irrespective, gold and gold stocks continue to look higher even as we might go through another corrective period. Lundin Gold Inc., for example, held in the Enriched Capital Conservative Growth Strategy*, reported increased gold ounces produced and sold, higher revenues, income, and cash flow, and announced an increased dividend.
Oil continues to trace out what we believe is a bottom but we have no confirmation.
We’re up in Ottawa this week and we are witnessing an old fashioned winter with 6 foot plus, plus snow banks. We have a few weeks of winter left. We return this week but next week’s report may still be shortened until we get back on our regular schedule.
Have a great week!
DC
* Reference to the Enriched Capital Conservative Growth Strategy and its investments, celebrating a 7-year history of strong growth, is added by Margaret Samuel, President, CEO, and Portfolio Manager of Enriched Investing Incorporated, who can be reached at 416-203-3028 or [email protected]
“Analyzing the chart is the easy part. Actually doing what the chart says? That’s the tough part.”
- Ralph Acampora, known as the Godfather of Technical Analysis, teacher, hedge fund advisor, market analytics developer, co-founder of the Markets Technicians Association, teacher at NY Institute of Finance, author of The Fourth Mega-Market, various brokerage firms including Smith Barney, Prudential Securities, Kight Capital, Alverita LLC Wealth Management; b. 1941
“Life is an illusion. You are what you think you are.”
- Yale Hirsch, founder of the Hirsch organization in 1966, founder of the publication The Stock Trader’s Almanac which provided studies on the January effect, the presidential cycle, and many more; 1923-2021
“I cannot give a formula for success, but I can give you a formula for failure: Try to please everyone.”
- Herbert Swope, American editor, journalist, intimate of the Algonquin Round Table, three-time recipient of the Pulitzer Prize for reporting, career New York World; 1882-1958
“He who saves his country does not violate any Law”
– Donald J. Trump, 45th and 47th president of the U.S.A., a dramatically reimagined scope of executive power which many believe is attributed to Napoleon Bonaparte and attributed to Louis XIV (L’État, c’est moi), said Feb 15, 2025; b. 1946
Chaos continues. Every day seems to bring a new level. Yes, we are not supposed to talk about politics, however, politics is dominating everything else. In turn, it eventually impacts markets. It may already be underway. Friday’s stock market massacre may be the start. The quote above from U.S. President Donald Trump highlights the growing chaos. Now in another Tweet (X) he has declared himself King. It even came with a Time Magazine-looking cover with Trump with a crown. For the record, the U.S. hasn’t had a king since George III at the time of the 1775-1783 American Revolution.
“CONGESTION PRICING IS DEAD, Manhattan, and all of New York, is SAVED. LONG LIVE THE KING!”
- President Donald J. Trump
Seen on X.com February 19, 2025 www.x.com
The stock market has held up thus far but it is now starting to teeter. We suspect it has held up primarily because of Trump’s promise to de-regulate and tax cuts. Tax cuts we suspect are to be funded with the estimated $2 trillion Elon Musk’s DOGE is supposed to find and cut in the U.S. budget. They have already fired thousands of government workers with more on the way. In one backtrack they realized they needed the people who worked at The National Nuclear Security Administration (NNSA). Un-firing the fired?
It appears that as they cut, even Social Security is not safe where they have declared it is full of waste and fraud. What that means remains to be seen. However, cuts have already occurred with some causing bigger problems, particularly as a result of cuts to the Federal Aviation Administration (FAA). There have been at least 5 plane crashes with deaths in the past month, a record for a sitting U.S. president. Protests are rising but remain largely peaceful, so far.
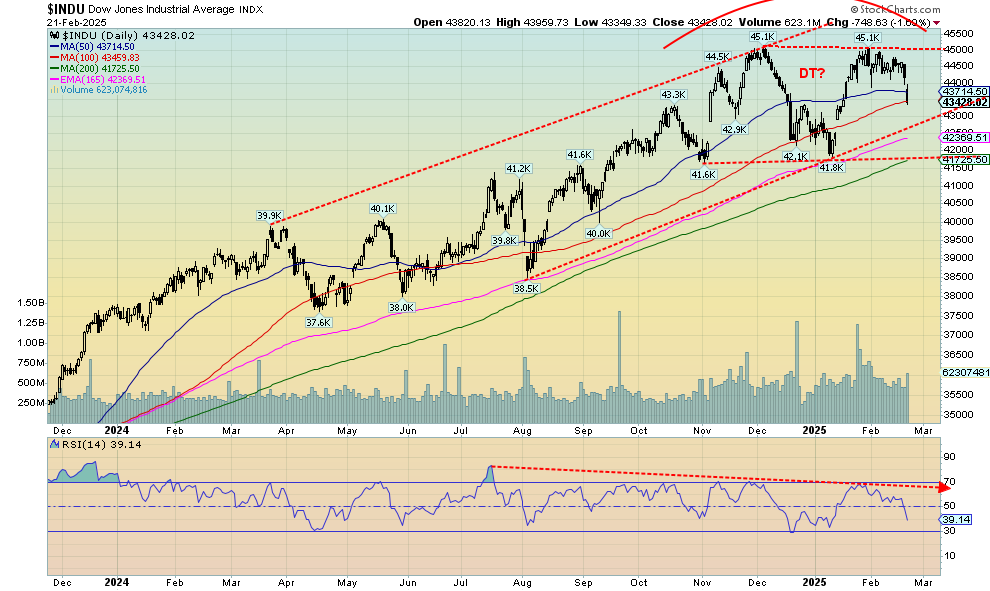
A beneficiary of the chaos has been gold which continues to set records even as it runs into resistance over $2,900. The S&P 500 also made a new all-time this past week (barely), however, no other index joined them. Mid and small-cap stocks took it on the chin as did the MAG7 and the FAANGS. A potential significant divergence. Both the NASDAQ and the Dow Jones Industrials (DJI) are rolling over below their previous top. The DJI appears to be making a double top.
Source: www.stockcharts.com
Is that a topping pattern the NASDAQ is making? Naturally, we can’t tell yet. We’d have to break down under 19,500 to start to confirm a top. In the interim new highs could still loom. The DJI appears to be making a clear double top. It breaks down under 42,000 and potentially projects down to 37,000. We await. The catalyst, as noted, for the recent drop was missed earnings from Walmart the world’s largest retailer. As well their guidance going forward was below expectations. Retail sales in January fell 0.9% well below the expected fall
of 0.1%. Year-over-year (y-o-y) retail sales were still up 4.2%. We expect retail sales to fall further as the chaos emanating from the White House continues and consumer confidence falls. Numerous areas including tourism are under attack as trips to the U.S. are canceled.
Source: www.stockcharts.com
We now appear to have real interest rates. As you can see with the 10-year chart of the U.S. 10-year treasury note vs. the annual rate of inflation what used to be a negative yield curve (10 years below the rate of inflation) has now turned to a positive yield curve (10 years above the rate of inflation). The spread is currently 154 basis points the highest spread since the 1980’s and 1990’s. Throughout much of the past twenty-plus years, the negative yield curve has contributed to the stock market bubble and the housing market. Combine that with quantitative easing (QE) and we had the makings of a bubble.
The positive yield curve should act as a dampening effect on markets going forward. Couple that with quantitative tightening (QT) which has been going on for some time. The Fed is caught between a rock and a hard place with rising inflation and a slowing economy (stagflation?). The Fed controls the short end of the debt market but the bond market controls the long end. The U.S. and the world is awash with debt. The potential for a global debt crisis is particularly high.
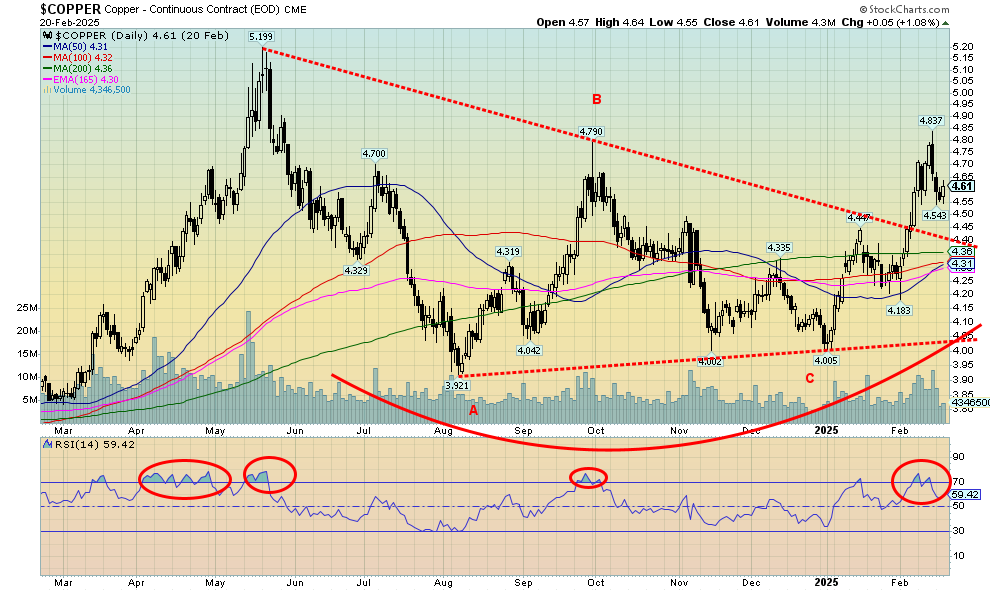
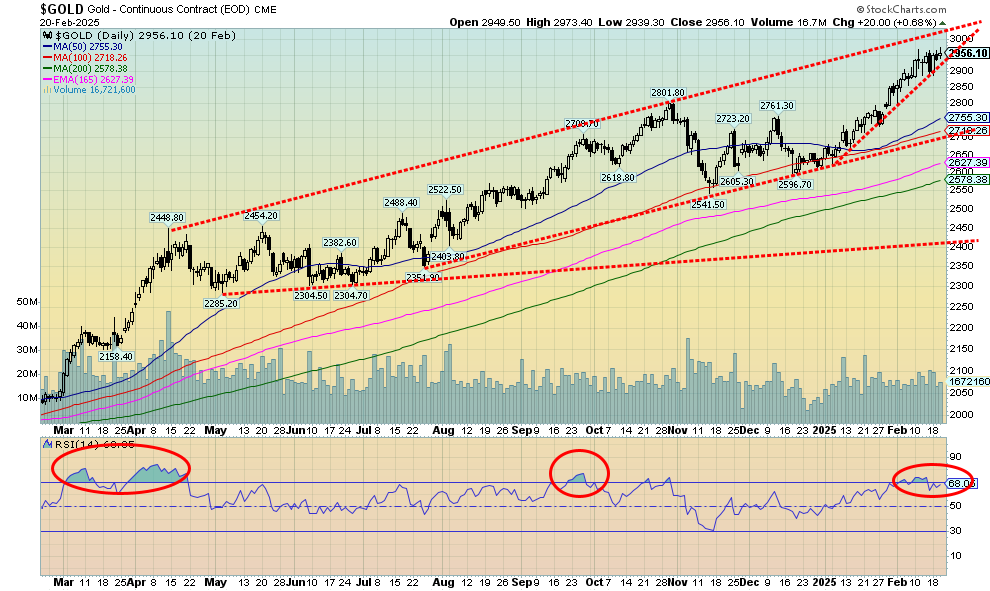
Copper prices have broken out and are rising. This is a sign of inflationary pressures. Copper is also a leading indicator for gold. As noted, gold has already been making new all-time highs. As the chaos continues, we expect it to rise further. We continue to have targets up around $3,600 although expect resistance along the way. There continue to be signs that gold is being pulled out of the London markets and transferred to the U.S. to avoid tariffs down the road. The only bothering sign for gold, at least in the near term is what appears as an ascending wedge triangle. If correct it is short-term bearish and gold, if it were to break under $2,900, could in effect see a decline to $2,700. Gold stocks took it on the chin on Friday, Feb 21, 202,5 alongside the 700+ point drop for the DJI. Not a good sign. If we do get that break (a real possibility) the next move up for gold would take us to $3,000 and higher.
U.S. 10-Year Treasury note vs. CPI rate of change 2016-2025
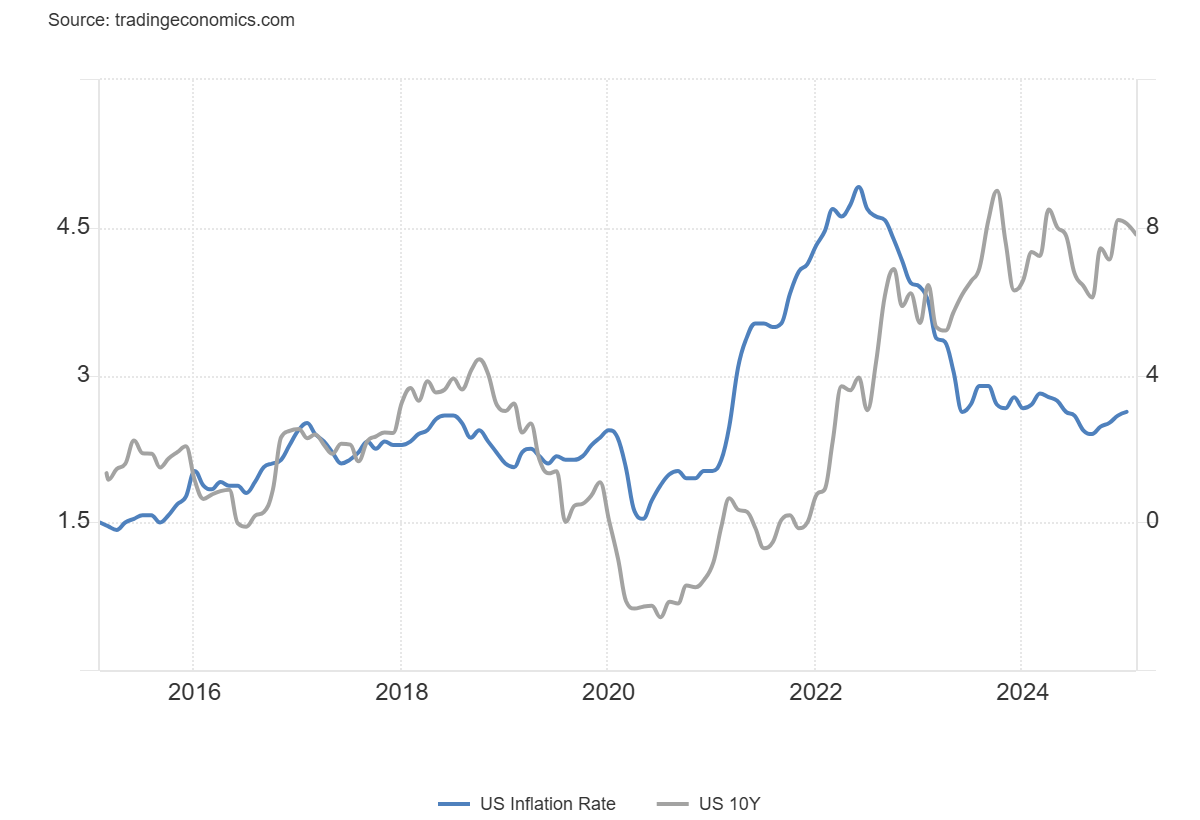
Source: www.tradingeconomics.com, www.bls.gov
Source: www.stockcharts.com
Source: www.stockcharts.com
We have consistently warned that tariffs and trade wars are potentially disastrous for both the economy and the stock market. The 1930 Smoot-Hawley Tariff Act was the trigger for the unleashing of global trade wars. The result, the stock market as represented by the Dow Jones Industrials (DJI) already under some pressure from the 1929 stock market crash that turned south in May 1930 and never bottomed until July 1932 down 89% from the September 1929 top. The economy contracted 26.7% from 1929-1933 while unemployment peaked at 24.9% in 1933. Tariffs are not new. During the 19th century, tariffs were actually beneficial as the U.S. and others grew behind tariff walls. However, once the global economy grew with free trade following WW2 millions were hauled out of poverty and countries prospered. All of that is now at risk under Trump tariffs.
1930’s Smoot-Hawley Tariffs vs. Proposed Tariffs Hikes under Donald Trump 1910-2025
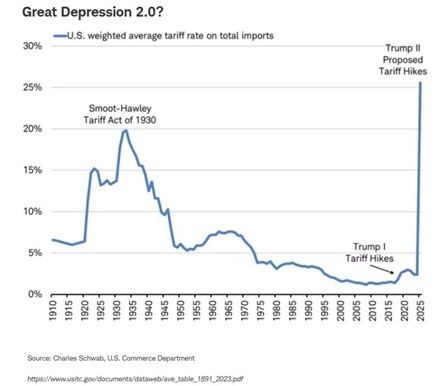
Source: www.commerce.gov Jonathan Baird CFA www.globalinvestmentletter.com
We constantly pick up charts and data showing the stock market is considerably overvalued. The chart on the next page is one of the best examples we have found. Cash levels as a percentage of total assets under management by equity funds are at their lowest level in years. We have seen some movement by smart money to raise cash best exemplified by Warren Buffett whose Berkshire Hathaway is sitting on an estimated monstrous $320 billion cash pile. Free cash flow yield is at its lowest level over the past 20 years. PE ratios, while they have come down are at their highest levels since the top of the dot.com bubble in 1999-2000.
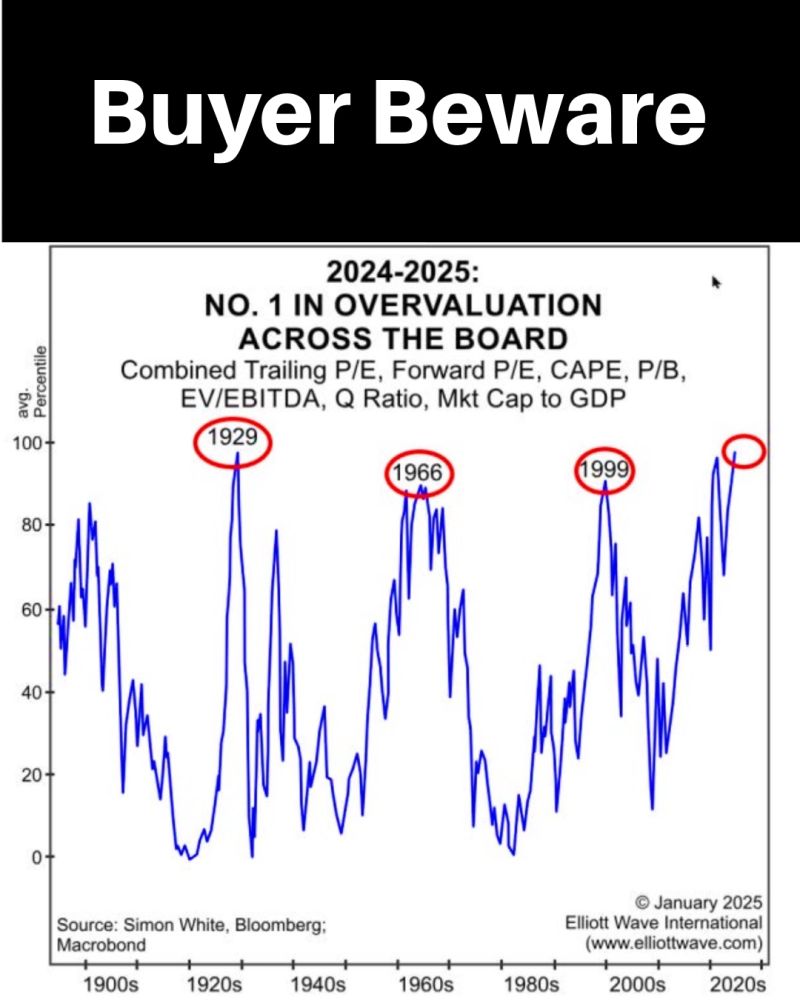
Source: www.elliotwave.com , www.bloomberg.com
Note the spikes in the Shiller PE seen in 1902, 1929, 1937, 1965, 1999, and 2008. All preceded major stock market declines and recessions/depressions. Is this time different? Not likely.
Shiller PE 1871-2025
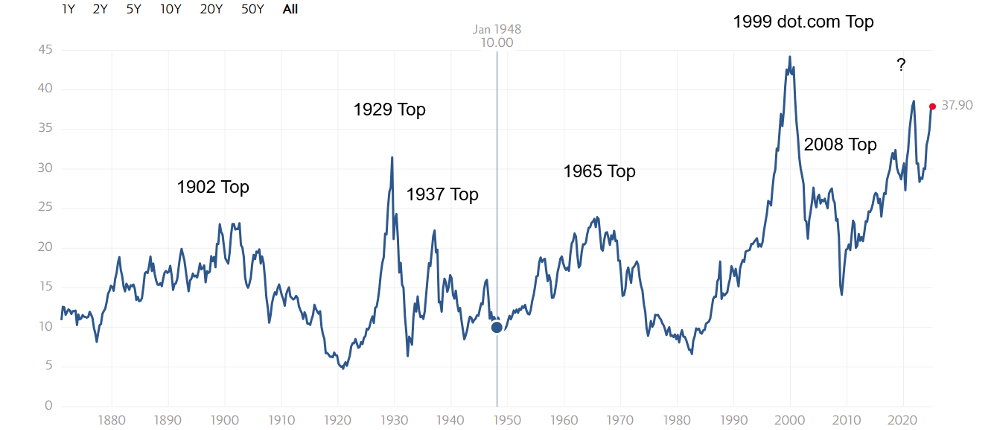
Source: www.multpl.com
Threats are lurking in the commercial real estate (CRE) market, the housing market, student loans, auto loans, and consumer credit card delinquencies. What if it negatively impacts the banks? That remains a real possibility. That is irrespective that banks today are better capitalized and regulated than they were prior to the 2008 financial crisis. Deregulation may have the opposite effect of creating potentially dangerous situations for banks. At the heart of recessions, one finds a banking crisis.
Volatility is rising. On Thursdays and Fridays, a 1,200-point decline for the DJI exemplifies the rising volatility. The put/call ratio is rising towards more puts than calls. However, neither the VIX nor the put/call ratio are at levels that could suggest a bottom. The New York Stock Exchange Advance/Decline (NYAD) diverged significantly with the rising DJI and SPX. All of these are further negative signs. The CNN fear/greed index is at fear while others such as the CNN market momentum and stock price strength are registering extreme fear. No surprise to see the put/call ratio is still registering greed even as it has probably topped in favor of calls over puts.
The NYSE FANG Index fell 4.7% this past week. The MAG7 stocks are reeling with Meta down 7.1% this past week following another all-time high, Amazon falling 5.3% and Tesla down 5.1%. Netflix (not a MAG7 stock) also made new all-time highs but finished down 5.2%. Only Apple was positive this past week up a mere 0.4%. We suppose anti-Trump fans would be pleased to know that Trump Media (DJT) fell 11.2% this past week. The bloom is off?
Chaos and volatility. Our themes for 2025. So far it is ongoing. In times of geopolitical tensions and economic stress, gold is the go-too asset.
Markets & Trends
|
|
|
|
% Gains (Losses) Trends |
|
||||
|
|
Close Dec 31/24 |
Close Feb 21/25 |
Week |
YTD |
Daily (Short Term) |
Weekly (Intermediate) |
Monthly (Long Term) |
|
|
Stock Market Indices |
|
|
|
|
|
|
|
|
|
S&P 500 |
5,881.63 |
6,013.13 (new highs) * |
(1.7)% |
2.2% |
up (weak) |
up |
up |
|
|
Dow Jones Industrials |
42,544.22 |
43,428.02 |
(2.5)% |
2.1% |
neutral |
up |
up |
|
|
Dow Jones Transport |
16,030.66 |
16,034.36 |
(3.5)% |
0.9% |
down (weak) |
up |
up |
|
|
NASDAQ |
19,310.79 |
19,524.01 |
(2.5)% |
1.1% |
neutral |
up |
up |
|
|
S&P/TSX Composite |
24,796.40 |
25,147.03 |
(1.3)% |
1.7% |
neutral |
up |
up |
|
|
S&P/TSX Venture (CDNX) |
597.87 |
634.69 |
(0.9)% |
6.2% |
up |
up |
neutral |
|
|
S&P 600 (small) |
1,408.17 |
1,378.06 |
(3.6)% |
(2.1)% |
down |
up |
up |
|
|
MSCI World |
2,304.50 |
2,478.41 |
0.2% |
7.6% |
up |
up |
up |
|
|
Bitcoin |
93,467.13 |
95,610.98 |
(1.4)% |
2.3% |
down |
up |
up |
|
|
|
|
|
|
|
|
|
|
|
|
Gold Mining Stock Indices |
|
|
|
|
|
|
|
|
|
Gold Bugs Index (HUI) |
275.58 |
320.59 |
(1.6)% |
16.3% |
up |
up |
up |
|
|
TSX Gold Index (TGD) |
336.87 |
402.50 |
(0.4)% |
19.5% |
up |
up |
up |
|
|
|
|
|
|
|
|
|
|
|
|
% |
|
|
|
|
|
|
|
|
|
U.S. 10-Year Treasury Bond yield |
4.58% |
4.43% |
(1.1)% |
(3.3)% |
|
|
|
|
|
Cdn. 10-Year Bond CGB yield |
3.25% |
3.13% |
1.0% |
(3.7)% |
|
|
|
|
|
Recession Watch Spreads |
|
|
|
|
|
|
|
|
|
U.S. 2-year 10-year Treasury spread |
0.33% |
0.23% |
9.5% |
(30.3)% |
|
|
|
|
|
Cdn 2-year 10-year CGB spread |
0.30% |
0.39% |
5.4% |
30.0% |
|
|
|
|
|
|
|
|
|
|
|
|
|
|
|
Currencies |
|
|
|
|
|
|
|
|
|
US$ Index |
108.44 |
106.64 |
0.1% |
(1.7)% |
down |
up |
up |
|
|
Canadian $ |
69.49 |
.7025 |
(0.4)% |
1.1% |
up |
down |
down |
|
|
Euro |
103.54 |
104.59 |
(0.3)% |
1.0% |
up |
down |
down |
|
|
Swiss Franc |
110.16 |
111.45 |
0.3% |
1.2% |
up |
down |
neutral |
|
|
British Pound |
125.11 |
126.29 |
0.3% |
0.9% |
up |
down |
neutral |
|
|
Japanese Yen |
63.57 |
67.03 |
2.1% |
5.4% |
up |
neutral |
down |
|
|
|
|
|
|
|
|
|
|
|
|
|
|
|
|
|
|
|
|
|
|
Precious Metals |
|
|
|
|
|
|
|
|
|
Gold |
2,641.00 |
2,953.20 (new highs) * |
1.8% |
11.8% |
up |
up |
up |
|
|
Silver |
29.24 |
33.01 |
0.5% |
12.9% |
up |
up |
up |
|
|
Platinum |
910.50 |
987.7 |
(3.1)% |
8.5% |
neutral |
up |
up (weak) |
|
|
|
|
|
|
|
|
|
|
|
|
Base Metals |
|
|
|
|
|
|
|
|
|
Palladium |
909.80 |
990.90 |
(1.8)% |
8.9% |
up (weak) |
up (weak) |
down |
|
|
Copper |
4.03 |
4.56 |
(2.2)% |
13.2% |
up |
up |
up (weak) |
|
|
|
|
|
|
|
|
|
|
|
|
Energy |
|
|
|
|
|
|
|
|
|
WTI Oil |
71.72 |
70.40 |
(0.4)% |
(1.8)% |
down |
down (weak) |
down |
|
|
Nat Gas |
3.63 |
4.27 (new highs) |
14.5% |
17.6% |
up |
up |
neutral |
|
Source: www.stockcharts.com
* New All-Time Highs
Note: For an explanation of the trends, see the glossary at the end of this article.
New highs/lows refer to new 52-week highs/lows and, in some cases, all-time highs.
GLOSSARY
Trends
Daily – Short-term trend (For swing traders)
Weekly – Intermediate-term trend (For long-term trend followers)
Monthly – Long-term secular trend (For long-term trend followers)
Up – The trend is up.
Down – The trend is down
Neutral – Indicators are mostly neutral. A trend change might be in the offing.
Weak – The trend is still up or down but it is weakening. It is also a sign that the trend might change.
Topping – Indicators are suggesting that while the trend remains up there are considerable signs that suggest that the market is topping.
Bottoming – Indicators are suggesting that while the trend is down there are considerable signs that suggest that the market is bottoming.
Disclaimer
David Chapman is not a registered advisory service and is not an exempt market dealer (EMD) nor a licensed financial advisor. He does not and cannot give individualised market advice. David Chapman has worked in the financial industry for over 40 years including large financial corporations, banks, and investment dealers. The information in this newsletter is intended only for informational and educational purposes. It should not be construed as an offer, a solicitation of an offer or sale of any security. Every effort is made to provide accurate and complete information. However, we cannot guarantee that there will be no errors. We make no claims, promises or guarantees about the accuracy, completeness, or adequacy of the contents of this commentary and expressly disclaim liability for errors and omissions in the contents of this commentary. David Chapman will always use his best efforts to ensure the accuracy and timeliness of all information. The reader assumes all risk when trading in securities and David Chapman advises consulting a licensed professional financial advisor or portfolio manager such as Enriched Investing Incorporated before proceeding with any trade or idea presented in this newsletter. David Chapman may own shares in companies mentioned in this newsletter. Before making an investment, prospective investors should review each security’s offering documents which summarize the objectives, fees, expenses and associated risks. David Chapman shares his ideas and opinions for informational and educational purposes only and expects the reader to perform due diligence before considering a position in any security. That includes consulting with your own licensed professional financial advisor such as Enriched Investing Incorporated. Performance is not guaranteed, values change frequently, and past performance may not be repeated.
Read the full article here