

The records keep on falling. Overbought is just a word. Over valuation is just a word. The US government has shut down for how long we don’t know. But one result was no job numbers this past week. And no inflation numbers either as the BLS puts out both. Result everyone is now flying blind especially the Fed. How this ends we don’t know. The two sides are intractable.
We await a black swan as domestic political tensions rise, and geopolitical tensions also rise. Economy slowing? Who knows with no numbers. Ok, we did get ADP employment and it wasn’t good. We cover that. And cover as much as we can.
But the answer remains: buy gold, gold stocks. And now we even have copper mine disasters pushing copper prices higher. Oil stocks appear to be being accumulated. Peyto Exploration and Development Corp., for example, reported increased earnings, greater cashflow from operations, reduced net debt, higher netback, pays a dividend, and is held in the Enriched Capital Conservative Growth Strategy.* Something could happen? Gold is indestructible. Everything else is paper.
We live in interesting times.
Drive through the Gaspe was gorgeous with fall colours. We’re home later in the week and hope to have a report out again next weekend.
Have a great week!
DC
* Reference to the Enriched Capital Conservative Growth Strategy and its investments, celebrating a 7 ½ -year history of strong growth, is added by Margaret Samuel, President, CEO and Portfolio Manager of Enriched Investing Incorporated, who can be reached at 416-203-3028 or [email protected]
“The desire of gold is not for gold. It is for the means of freedom and benefit.”
- Ralph Waldo Emerson, American essayist, lecturer, philosopher, minister, abolitionist, poet, led the Transcendentalist movement in the mid-19th century, champion of individualism and critical thinking; 1803-1882
“Gold is the money of kings; silver is the money of gentlemen; barter is the money of peasants; but debt is the money of slaves.”
- Norm Franz, author of Money and Wealth in the New Millenium, biblical economist, monetary economist, insights into the world’s financial systems, worked with business, governments, and church leaders
“Gold will be around. Gold will be money when the dollar and the euro and the yuan and ringgit are mere memories.”
- Richard Russell, American writer on finance, proponent of the Dow Theory and known for his letter on the same; 1924-2015
U.S. Jobs Report
U.S. jobs report? What jobs report? With the inconvenient shutdown of the U.S. government, the September jobs report that was due on Friday, October 3 won’t be coming out. We also did not see the weekly initial claims report. Both are produced by the Bureau of Labour Statistics (BLS), one of President Trump’s targets. As a result, we and every other pundit who studies these numbers are now flying blind.
Yes, we did get the ADP employment report. It’s an independent measure that only looks at private sector hiring and firing. This week that report came out with a loss of 32,000 jobs vs. an expected gain of 50,000. The ADP report has been generally on a downward trend over the past year. The biggest losses were in hospitality and leisure and professional services. The ADP report can vary with the nonfarm payrolls, but over time the two tend to blend together.
This is not good news, confirming what many of us thought. If the September jobs report were out, we suspect it was not going to be a good one. President Trump has already fired one head of BLS, appointed a temporary replacement, and is now looking for someone loyal to them to run the place. This would put all its reports in jeopardy and we’d be questioning the validity of the reports. With the shutdown it is academic.
But it is not just the jobs data that is negatively impacted. The monthly inflation report is produced by the BLS as well. No inflation report means the Fed is flying blind. Naturally, all of this is an assumption because no one at this point knows how long this shutdown will last. In the past it has lasted anywhere from a couple of days to 35 days. Oh, should we be surprised? The longest shutdown ever was also under Trump in his first term.
If you’re impacted; you’re laid off with no pay. Essential workers remain but are not paid. Will they stay on? There are three big numbers every month – jobs, inflation, and GDP. Two of the three are knocked out as a result of this shutdown.
A few other points. There are more people unemployed than there are job openings. Skills and requirements do not often match. The number of people being laid off and discharged has been on a steady upward plane, albeit the rise is uneven. Mass layoffs have not as yet occurred. New hires have been on a steady decline, apparently down 58% year to date. But it was also hidden as public sector jobs grew while the private sector fell. The hardest hit has been small- and medium-size businesses, whereas large companies have actually net added jobs. U.S. employers are cautious right now but that could change quickly if things deteriorate further.
Does the stock market care? It seems not. However, safe haven gold continues to climb to record prices. The U.S. dollar has weakened and bond yields slipped. But if this shutdown drags on, then the stock market will feel pain and gold should rise further.
We live in increasingly uncertain times.
Canada’s job report is out next Friday, October 10. Statistics Canada is on the job.
Source: www.tradingeconomics.com, www.adp.com
Markets & Trends
|
|
|
|
% Gains (Losses) Trends |
|
||||
|
|
Close Dec 31/24 |
Close Oct 3/25 |
Week |
YTD |
Daily (Short Term) |
Weekly (Intermediate) |
Monthly (Long Term) |
|
|
|
|
|
|
|
|
|
||
|
S&P 500 |
5,881.63 |
6,715.79 (new highs) * |
1.1% |
14.2% |
up |
up |
up |
|
|
Dow Jones Industrials |
42,544.22 |
46,758.28 (new highs) * |
1.1% |
9.9% |
up |
up |
up |
|
|
Dow Jones Transport |
16,030.66 |
15,840.61 |
0.7% |
(0.3)% |
up |
neutral |
up |
|
|
NASDAQ |
19,310.79 |
22,780.51 (new highs) * |
1.3% |
18.0% |
up |
up |
up |
|
|
S&P/TSX Composite |
24,796.40 |
30471.58 (new highs) * |
2.4% |
23.2% |
up |
up |
up |
|
|
S&P/TSX Venture (CDNX) |
597.87 |
964.04 new highs) |
3.2% |
61.3% |
up |
up |
up |
|
|
S&P 600 (small) |
1,408.17 |
1,465.17 |
1.3% |
4.1% |
up |
up |
up |
|
|
MSCI World |
2,304.50 |
2,859.26 (new highs)* |
2.4% |
24.1% |
up |
up |
up |
|
|
Bitcoin |
93,467.13 |
1122,255.22 |
11.7% |
30.8% |
up |
up |
up |
|
|
|
|
|
|
|
|
|
|
|
|
Gold Mining Stock Indices |
|
|
|
|
|
|
|
|
|
Gold Bugs Index (HUI) |
275.58 |
620.10 (new highs) |
2.6% |
125.0% |
up |
up |
up |
|
|
TSX Gold Index (TGD) |
336.87 |
742.49 (new highs) * |
2.5% |
120.4% |
up |
up |
up |
|
|
|
|
|
|
|
|
|
|
|
|
% |
|
|
|
|
|
|
|
|
|
U.S. 10-Year Treasury Bond yield |
4.58% |
4.12% |
(1.4)% |
(10.0)% |
|
|
|
|
|
Cdn. 10-Year Bond CGB yield |
3.25% |
3.19% |
(1.2)% |
(1.9)% |
|
|
|
|
|
Recession Watch Spreads |
|
|
|
|
|
|
|
|
|
U.S. 2-year 10-year Treasury spread |
0.33% |
0.54% |
1.9% |
63.6% |
|
|
|
|
|
Cdn 2-year 10-year CGB spread |
0.30% |
0.74% |
1.4% |
146.7% |
|
|
|
|
|
|
|
|
|
|
|
|
|
|
|
Currencies |
|
|
|
|
|
|
|
|
|
US$ Index |
108.44 |
97.69 |
(0.5)% |
(9.9)% |
up |
down |
down |
|
|
Canadian $ |
69.49 |
0.7168 |
flat |
3.2% |
down |
up |
neutral |
|
|
Euro |
103.54 |
117.43 |
0.4% |
13.4% |
up |
up |
up |
|
|
Swiss Franc |
110.16 |
125.72 |
0.3% |
14.1% |
up |
up |
up |
|
|
British Pound |
125.11 |
134.84 |
0.6% |
7.8% |
down (weak) |
up |
up |
|
|
Japanese Yen |
63.57 |
67.83 |
1.4% |
6.7% |
up (weak) |
neutral |
down (weak) |
|
|
|
|
|
|
|
|
|
|
|
|
|
|
|
|
|
|
|
|
|
|
Precious Metals |
|
|
|
|
|
|
|
|
|
Gold |
2,641.00 |
3,883.65 (new highs) * |
3.1% |
47.1% |
up |
up |
up |
|
|
Silver |
29.24 |
47.96 (new highs) |
3.8% |
64.0% |
up |
up |
up |
|
|
Platinum |
910.50 |
1,619.30 (new highs) |
2.0% |
77.9% |
up |
up |
up |
|
|
|
|
|
|
|
|
|
|
|
|
Base Metals |
|
|
|
|
|
|
|
|
|
Palladium |
909.80 |
1,261.50 |
(1.9)% |
38.7% |
up |
up |
neutral |
|
|
Copper |
4.03 |
5.04 |
6.8% |
25.1% |
up |
neutral |
up |
|
|
|
|
|
|
|
|
|
|
|
|
Energy |
|
|
|
|
|
|
|
|
|
WTI Oil |
71.72 |
60.81 |
(7.0)% |
(15.2)% |
down |
down |
down |
|
|
Nat Gas |
3.63 |
3.33 |
4.7% |
(8.3)% |
up |
down |
down (weak) |
|
Source: www.stockcharts.com
* New All-Time Highs
Note: For an explanation of the trends, see the glossary at the end of this article.
New highs/lows refer to new 52-week highs/lows and, in some cases, all-time highs.
S&P 500
Source: www.stockcharts.com
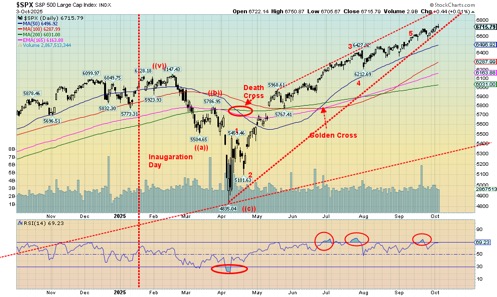
The train keeps a-rolling. The records keep on falling. Government shutdown? Boring. Slowing economy? Yawn. Political tensions? Who cares. Overvaluations? So what. Just buy, buy, buy. Yes, onward and upward. Once again, the records fall – S&P 500, Dow Jones Industrials (DJI), NASDAQ. Also add in the S&P 500 Equal Weight Index, the Dow Jones Composite (DJC), the NASDAQ 100, the S&P 100 (OEX), the Russell 1000 and 3000, and the Wilshire 5000 and the records keep on falling. Is there a bump anywhere? Yes, for the longest time we can remember the Dow Jones Transportations (DJT) remains well below its all-time high, thus breaking a cardinal rule of Dow Theory that the indices must agree with each other. As well for this past week, while markets rose and made all-time highs, the NY FANG Index fell 0.1% and did not make new highs. The MAGS, the MAG7 ETF, also failed to make new highs and was off 0.1%. The MAG7 led the way up, while 10 big AI stocks dominate the S&P 500 and the NASDAQ. If they falter, will the rest of the market succumb to the laws of nature that what goes up must also come down?
Interestingly, this past week for the MAG7 Nvidia hit all-time highs, up 5.3%, but Meta fell 4.5%, Amazon was off 0.1%, Google was down 0.3%, and Tesla was off 2.4%. Broadcom was up 1.2%, Apple gained 1%, and Microsoft up 1.2%. The big stars of the week were the Chinese stocks: Alibaba up 9.4% and Baidu up 8.1%, both to all-time highs. The train keeps a-rolling.
The market has been rising on a continuing wall of liquidity. The pandemic saw trillions pumped in and it has not all been drained. Earnings have been resilient in the face of a host of problems. They overpower concerns elsewhere. Corporate buybacks help, along with a steady flow of passive investments (ETFs). The stock market is still viewed as a safe haven, away from the problems. Money market funds pay well, so why bother with stocks, but if rates are cut there is some flow to the equity market. Foreign money is fleeing even bigger problems elsewhere. AI remains the big story. CNBC still talks up AI while almost completely ignoring gold. And then there is FOMO, the fear of missing out. Equities outperform inflation.
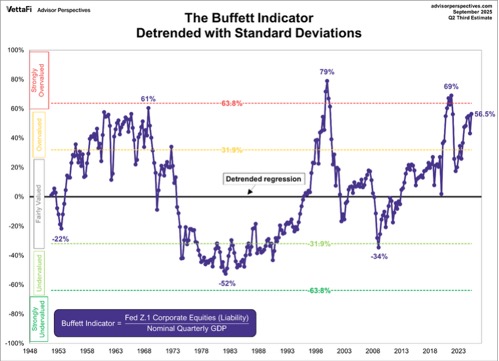
However, lurking in behind is greed, overvaluation, narrowing breadth, and slowing momentum. Put/calls remain very bullish. Market cap to GDP is in nosebleed territory as shown by our chart below of the Buffett Indicator which takes the market cap of equities and divides it by GDP. A black swan event could change everything in a hurry. Are there any potential black swans? Yes: war drums in Europe and the deteriorating political situation in the U.S. are two of our biggest ones. But something else may come out of the blue.
On the week, the S&P 500 rose 1.1%, the DJI was up 1.1%, the DJT was up 0.7%, the NASDAQ was up 1.3%, the S&P 400 (Mid) was up 0.7%, the S&P 600 (Small) was up 1.3%, the S&P 500 Equal Weight Index was up 1.4% but the NY FANG Index fell 0.1%.
In Canada, the TSX, led once again by Golds, Metals and Materials, made all-time highs, up 2.4%, while the TSX Venture Exchange (CDNX) made 52-week highs, again up 3.2%. The CDNX is closing in on the 2021 high but still a long way from the 2008 high. In Europe, the London FTSE made all-time highs, up 2.2%, and so did the EuroNext, up 2.8%. The Paris CAC 40 rose 2.7% and the German DAX gained 2.7%. In Asia, China’s Shanghai Index (SSEC) was up 1.4%, the Tokyo Nikkei Dow (TKN) gained 0.9%, and Hong Kong’s Hang Seng (HSI) made all-time highs, up 3.9%. The records keep on falling.
Where do we top? We don’t know. When do we end? We don’t know. All we suspect is we are running out of time. In 2007 the high was October. Then came the financial crisis and a 55% drop in the market. Under 6,700 could prove problematic. But really big trouble doesn’t get under way until under 6,400 and 6,200. The warning signs are all there. But until we break, the records keep on falling.
The Buffett Indicator 1950-2025
Source: www.dshort.com,
U.S. Bonds
Source: www.stockcharts.com
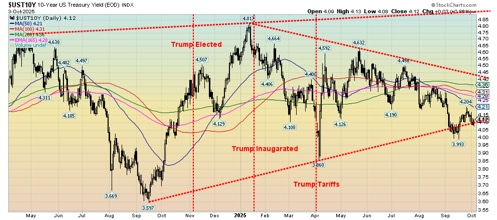
For the past month the 10-year U.S. Treasury note has been trading between 4.20% and 4.00%. This week we closed roughly in the middle at 4.12%. That’s down from the previous week’s 4.18%. Canada too, as the 10-year Government of Canada bond (CGB) closed at 3.19%, down from 3.23% the previous week. Bonds are hesitating as they don’t know whether we are facing a sinking economy or rising inflation; i.e., stagflation. The result is the current uncertainty of the next move. Here we just use the break points. Below 4.00% we are probably headed lower; above 4.20% we’re headed higher, although we’d confirm that better with a breakout above 4.32% and better still above 4.40%. To the downside taking out that 3.86% low in April would help confirm lower yields. Bonds are normally a safe haven, especially U.S. treasuries. But given the current political tensions in the U.S., even holding U.S. treasuries is an iffy proposition. Government shutdowns? Even that could negatively impact bond auctions. Obviously, payment on the debt remains paramount. But given the current unpredictability in the U.S., even that might not be a safe bet. Rising demand for funds from the U.S. treasury doesn’t help. The U.S. runs the biggest deficits in the world and demand is predicted to rise further. Countries like Japan and China have been trimming their holdings. Others have picked up the pace, particularly the U.K. In the end bonds, bills, and notes are just paper. All three major rating agencies – S&P, Moody’s and Fitch – have taken away the U.S.’s AAA rating. It’s now a notch below. But the U.S.’s propensity for rising debt, rising interest costs (now over $1 trillion annually), and the growing political failures and instability put the U.S. on careful watch. Gold is safer than U.S. treasuries. The U.S. dollar is the world’s reserve currency, but its status is being severely challenged. Reserve currencies come and go, but it is usually a period of instability, economic tensions, and war.
Gold and Silver
Source: www.stockcharts.com
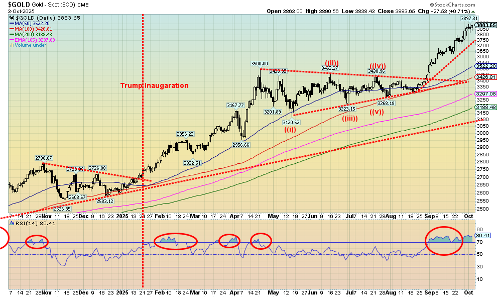
Shutdowns. Rate cuts. Geopolitical tensions. Domestic political tensions. Economy tensions. It all adds up for gold that keeps setting records. Oh yes, the shutdown. It even impacts gold as this week’s COT report is cancelled because the CRTC is a federal agency. China is on holidays where normally there is a lot of gold demand, but who cares. As a result, gold rises for the seventh week in a row. December futures went over $3,900. And, as we see in the chart above, we closed at $3,883.65. Coming soon – $4,000. Overbought? You bet. But so far, the market doesn’t care.
Just like the stock market, the gold market keeps setting records. The Gold Bugs Index (HUI) is now only 19 away from its all-time 2011 high. Similarly, silver is roughly only $2 away from its 1980 and 2011 high. As a reminder, though, those are nominal levels. On inflation-adjusted levels we have a way to go. Silver needs to reach nearly $200. The HUI 920. The TSX Gold Index (TGD)? We’ve surpassed it already. Ditto for gold.
On the week, gold rose 3.1% to all-time highs, silver was up 3.8% to 52-week highs, and platinum rose 2% to 52-week highs. Palladium struggles, falling 1.9%, while copper, thanks to the Freeport McMoran mine disaster and mine issues in Chile sparking supply disruptions, jumped 6.8%. My colleague Mike Ballanger who follows copper closely believes it’s on the verge of going parabolic. Billionaire financier Robert Friedland CEO of
Ivanhoe Mines is saying the same thing. Copper is needed in just about everything.
Not to be outdone, the miners also rose with the HUI, up 2.6% to new 52-week highs, and the TGD gained 2.5% to new all-time highs once again. It’s been a golden year. The HUI is up 125% in 2025 while the TGD has gained 120%. Some individual stocks even more. Better still, the moribund junior miner developers are also coming to life. With junior developers one can have a life-changing moment as they gain doubles, triples, and even 10- baggers. Yet the TSX Venture Exchange (CDNX) that is at least 50% miners is still below its 2021 high, let alone its 2008 high. On the TSX, Gold (TGD), Metals & Mining (TGM) and Materials (TMT) continue to make new highs.
The question is, is it still safe to buy? As long as we continue to have tensions and uncertainty, gold is where one should be. Yes, overbought and corrections, even sharp ones can occur, but overall, we continue to look higher. This past week we had a sudden downdraft on Thursday, but by Friday it was all recovered. We note Thursday’s low at $3,820. If that breaks, we are probably headed for a little deeper correction. Overall, we aren’t in a deeper correction until we are under $3,700. A test of the 200-day MA can never be ruled out. Currently, that is near $3,500.
Yes, the stock market has been relentlessly climbing. But it’s heavily concentrated in the MAG7 and the FAANGs. If they falter, the market could be in trouble. Overvaluation in the stock market is a concern, but not in the gold market. Just keep up the tensions. And for that we see no sign they are going to abate any time soon. Gold stocks are still undervalued. Gold has no liability. Gold is indestructible. All the gold ever produced is still with us. Paper (i.e., stocks, bonds, even your house, and oh yes, Bitcoin)? It can be gone in a nano second.
Elsewhere, currencies were once again relatively flat with the US$ Index down 0.5%. The other currencies were mostly up with the Japanese yen up 1.4%. Oil continues to be in the doldrums (there is too much of it) with WTI oil down 7%, Brent crude off 7.5%, but natural gas (NG) rising 4.7%. Except that over at the EU Dutch Hub NG fell 2.8%. The ARCA Oil & Gas Index (XOI) was off 4.3% while the TSX Energy Index (TEN) fell 2.7%. Overall, the stocks have been performing better than the commodity. That may be a sign of accumulation for the sector. War drums keep beating in Europe. Not a good sign.
We’re looking for a gold correction. We have expectations of a low in the November/December period. What could cause it? An uptick in inflation and interest rates, resolution of the shutdown, or war drums dying down? Or more. But still no sign yet of a top. Watch $3,800 for clues.
GLOSSARY
Trends
Daily – Short-term trend (For swing traders)
Weekly – Intermediate-term trend (For long-term trend followers)
Monthly – Long-term secular trend (For long-term trend followers)
Up – The trend is up.
Down – The trend is down
Neutral – Indicators are mostly neutral. A trend change might be in the offing.
Weak – The trend is still up or down but it is weakening. It is also a sign that the trend might change.
Disclaimer David Chapman is not a registered advisory service and is not an exempt market dealer (EMD) nor a licensed financial advisor. He does not and cannot give individualised market advice. David Chapman has worked in the financial industry for over 40 years including large financial corporations, banks, and investment dealers. The information in this newsletter is intended only for informational and educational purposes. It should not be construed as an offer, a solicitation of an offer or sale of any security. Every effort is made to provide accurate and complete information. However, we cannot guarantee that there will be no errors. We make no claims, promises or guarantees about the accuracy, completeness, or adequacy of the contents of this commentary and expressly disclaim liability for errors and omissions in the contents of this commentary. David Chapman will always use his best efforts to ensure the accuracy and timeliness of all information. The reader assumes all risk when trading in securities and David Chapman advises consulting a licensed professional financial advisor or portfolio manager such as Enriched Investing Incorporated before proceeding with any trade or idea presented in this newsletter. David Chapman may own shares in companies mentioned in this newsletter. Before making an investment, prospective investors should review each security’s offering documents which summarize the objectives, fees, expenses and associated risks. David Chapman shares his ideas and opinions for informational and educational purposes only and expects the reader to perform due diligence before considering a position in any security. That includes consulting with your own licensed professional financial advisor such as Enriched Investing Incorporated. Performance is not guaranteed, values change frequently, and past performance may not be repeated.
Read the full article here