

We’re back, and the records keep on falling. Good earnings, the economy is still chugging, a few trade deals, and unemployment is still low. What, we worry? We continue with our shorter summer reports.
U.S.stock markets continue to make new highs, mostly. Most notably, the DJI and DJT have not, although the DJI is getting close. The Epstein files have surpassed worries about the economy. Are the Epstein files Trump’s equivalent of Watergate? Gold is waffling, but the other metals and the gold stocks have made new highs again. Oil prices are languishing.
Despite the all-time highs, the stock market continues to indicate technical deterioration. Our chart of the week highlights how the S&P 500 is trading along an upper channel of a channel created off the 1929 high. The last time that occurred, the stock market was followed by a 53% decline. Long-term interest rates are steady, but our chart is ambiguous as to whether rates will rise or fall.
This week could bring some fireworks. Wednesday sees the interest rate decisions first from the Bank of Canada, then from the Fed. The expectation is that both will stand pat. We also get Q2 advance GDP and PCE. On Friday, we get the July employment numbers that are expected to show lower job creation and marginally higher unemployment. We also get the Michigan Sentiment Index final for July.
After rising to record highs over the past few months, maybe there should be some trepidation about August/September, the two worst months of the year. Then there is the crash month, October. Bankruptcies have been rising this year, but so far we haven’t had a Lehman Brothers moment. The AI bubble continues, and Nvidia is the $4 trillion company, making it equivalent to the fourth-largest economy in the world behind the U.S., China, and Germany. Thomson Reuters Corporation, a content and technology company, also harnesses the potential of AI, recently announced increased revenue, earnings, and dividends, and is held in the Enriched Capital Conservative Growth Strategy.* Elon Musk continues to be the richest man in the world at a level that would rank him as the 42nd largest economy in the world.
We’re 40% of the way through summer 2025. Lots of good weather is still ahead of us, and hopefully, the hot days are behind us. Have a great week.
DC
* Reference to the Enriched Capital Conservative Growth Strategy and its investments, celebrating a 7 ½ -year history of strong growth, is added by Margaret Samuel, President, CEO, and Portfolio Manager of Enriched Investing Incorporated, who can be reached at 416-203-3028 or [email protected]
“An investment in knowledge pays the best interest.”
—Benjamin Franklin, American polymath: writer, scientist, inventor, statesman, diplomat, printer, publisher, political philosopher, one of the founding fathers of the U.S., one of the drafters and signers of the Declaration of Independence; 1705–1790
“Bottoms in the investment world don’t end with four-year lows; they end with 10- or 15-year lows.”
—Jim Rogers, American investor and commentator, Chairman of Beeland Interests Inc., co-founder of the Quantum Fund and Soros Fund Management, creator of the Rogers International Commodities Index, views said to be close to the Austrian School of Economics; b. 1942
“Be fearful when others are greedy and greedy only when others are fearful.”
—Warren Buffett, American investor and philanthropist, Chairman and CEO of Berkshire Hathaway, known as the Oracle of Omaha; b. 1930
The quotes above are timeless, even iconic, investment quotes. There are others. One of my favourites is:
“Millionaires don’t use astrology, billionaires do.”—attributed to J.P. Morgan, the investment banker who dominated Wall Street during the Gilded Age and the Progressive Era and founded the bank that became J.P. Morgan Chase (1837–1913)
Another iconic and contrarian quote is:
“The four most dangerous words in investing are, it’s different this time.”—from Sir John Templeton, the fund manager who founded the Templeton Growth Fund (1912–2008)
Sir John Templeton may have made the quote, but it was economists Carmen Reinhart and Kenneth Rogoff who wrote the book This Time is Different: Eight Centuries of Financial Folly (2009). This book outlines how, over the centuries, we have been plagued by financial crises, including government defaults, banking panics, and inflationary spikes. They have ranged from medieval currency crises to the subprime debacle of 2007–2009. We may have another one in the AI mania.
Technology manias have been a fact of life ever since the start of the Industrial Revolution, with the most iconic being these:
- The radio and electronics bubble in the 1920s, peaking in 1929
- The Nifty Fifty market of the late 1960s to early 1970s, topping in 1972–1973
- The dot.com bubble of 1995–2000
- The current AI/chip bubble that has been in place since 2023
The 2000s have already seen their share of bubbles that burst, even as some recovered, including:
- The 3D printing and clean tech bubble of 2012-2021 that ended with 3D printing stocks falling 80%
- The cryptocurrency Blockchain bubble of 2017–2018 that peaked in December 2017 and then saw Bitcoin fall 80%
- The COVID tech bubble of 2020–2021 that saw work-from-home technology (e.g. Zoom) show huge growth and then, poof, fall 70–90% by 2022–2023
- The SPAC and EV bubble of 2020–2021. SPAC stands for Special Purpose Acquisition Companies. Most of these companies collapsed into bankruptcy by 2022
The AI bubble is just the latest, as it really took off with ChatGPT and is led by Nvidia. And, lest we forget, railways led a sharp rise in the stock market in the 1880s during what was known as the Gilded Age. In the 1890s, stock markets fell by over 50% and there was an economic depression.
Today’s market exhibits signs of a bubble but continues with strong or, at least, decent fundamentals. Unemployment is rising but not soaring, even as layoffs seem to be mounting; the economy is still growing albeit at a slower pace as Q1 showed a contraction of 0.1%; we await the potential negative impact of Trump’s tariffs; the EU economy is stagnating; interest rates are down but they haven’t been sent to the depths that were seen during the pandemic when rates were reduced to close to zero, triggering a speculative boom in the stock market and housing; corporate earnings remain good, up sharply since 2020 despite high valuations; and the consumer is still spending, even while at the same time they appear to be stretched. Add in expectations of interest rate cuts and the potential effects of Trump’s tax cuts, and everything is just hunky-dory. Buy, buy, buy.
Source: www.longtermtrends.net
Signs are emerging that the stock market could be topping. Fear and greed are what drive the market, and right now, the CNN Fear and Greed Index is registering extreme greed. Valuations are high with the Shiller PE ratio at 38.45 vs. the long-term mean of 17.26. Many say the valuations are worthy, given the dominance and what it means for the future of the tech/AI market. The current Shiller PE exceeds all the other bubbles except the dot.com bubble of 2000. The Buffett Indicator (above) is registering its highest level ever (value of all publicly traded stocks/GDP ratio). Many other indicators, such as junk bond demand, the Maclellan Summation Index, and new 52-week highs vs. new lows, are all registering extreme greed. As a counter, safe havens such as gold are also rising. Somehow, Bitcoin and the cryptos are also considered safe havens, even as pundits such as J.P. Morgan CEO Jamie Dimon call that a Ponzi scheme. But is it too in a bubble? Bitcoin and other cryptos have recently hit all-time highs.
Shiller PE Ratio 1870–2025

Source: www.multpl.com
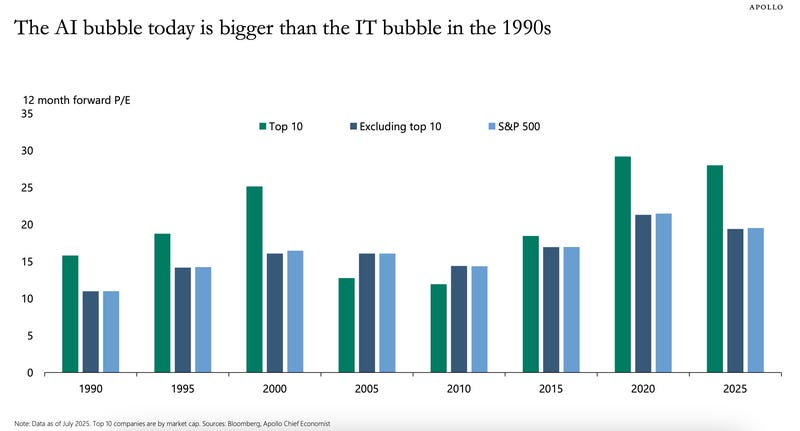
Many point out the lofty valuations of the top 10 companies that trade on the S&P 500. The AI bubble today is higher than it was at the top in March 2000 for the dot.com bubble. Can it continue? The Fed most likely will be cutting rates at some point (maybe in September?), but President Trump wants that to happen now as he continues a high-profile fight with Fed Chair Jerome Powell, a man he wants to fire. Trump should be careful what he wishes for, as the bond market, in particular, won’t view that positively. The FOMC meets this coming week for its interest rate decision. Consensus has the Fed standing pat.
However, the stock market is being driven higher as investors chase performance. Retail is piling in as well, and capital flows are still coming to the U.S. stock market that many view as a safe haven with higher performance. Trump’s tax cuts that largely benefit the very wealthy won’t invest their money in new plants and labour, but more likely into the stock market. Signed trade deals are also helping, along with signs that tariffs are triggering a bonanza of cash for the government. The S&P 500 is outperforming international exchanges (S&P 500 vs. the MSCI World Index) since the pandemic. But, so far in 2025, the MSCI Index is outperforming. Is this time really different? Take out the positive effects of the 10 largest companies, and we note that the S&P 500 Equal Weight Index is outperforming the S&P 500.
Source: www.bloomberg.com, www.businessinsider.com
The stock market is showing no fear as it expects the money to keep flowing from tax cuts and lower interest rates. However, we can’t help but notice that stock market volume seems to rise more on down days than on up days. Another negative sign and a sign of distribution?
Overlooked in all this is the fear in the broader society. As has become obvious, President Trump does not accept dissent. This, in turn, is creating a climate of fear. Firings in government civil service across a number of departments, including education, the Pentagon, and more, have triggered fears that professional civil servants are to be replaced by political loyalists. Law firms are reeling from attacks, and many are bending to Trump’s will in order to maintain contracts and more. There is also an ongoing attack on the entire legal system. Education is under attack, as there are threats to eliminate the entire education department. Universities in particular are under attack, creating a climate of fear there as they fight to maintain academic freedom. Companies and non-profits have been threatened with loss of contracts and funding unless they bend to the president’s will.
It goes further as the media is under attack with a loss of funding for PBS and NPR. Add in payments to the Trump library from media companies that need approval from the Trump administration for mergers, etc. (e.g., CBS and ABC). The attack on the media has become more pronounced with the cancellation of Stephen Colbert’s late-night show. Colbert has been a strong critic of President Trump. The hosts of other late-night shows are also under attack for their strong criticism of Trump, using comedy and satire. Newspapers such as The New York Times and The Washington Post, and news channels such as CNN are regularly referred to as “fake news.” The venerable Wall Street Journal and News Corp. are being sued by Trump for $10 billion for libel as a result of a story connecting him to the late Jeffrey Epstein. The Epstein case is exploding in the headlines due to the perception that there could be a cover-up.
But the biggest fear is in the immigrant community, where many with no connection to violence or criminality are being deported or sent to immigration camps (concentration camps?). Canada, a neighbour, has some 55 Canadians being detained in holding camps. Protests against the tactics of ICE (Homeland Security) and the Trump administration have been rising, but have not yet turned violent.
Greed in the stock market; fear on the street. A deadly combination. No wonder gold is rising.
Chart of the Week
S&P 500 1925–2025
Source: www.stockcharts.com
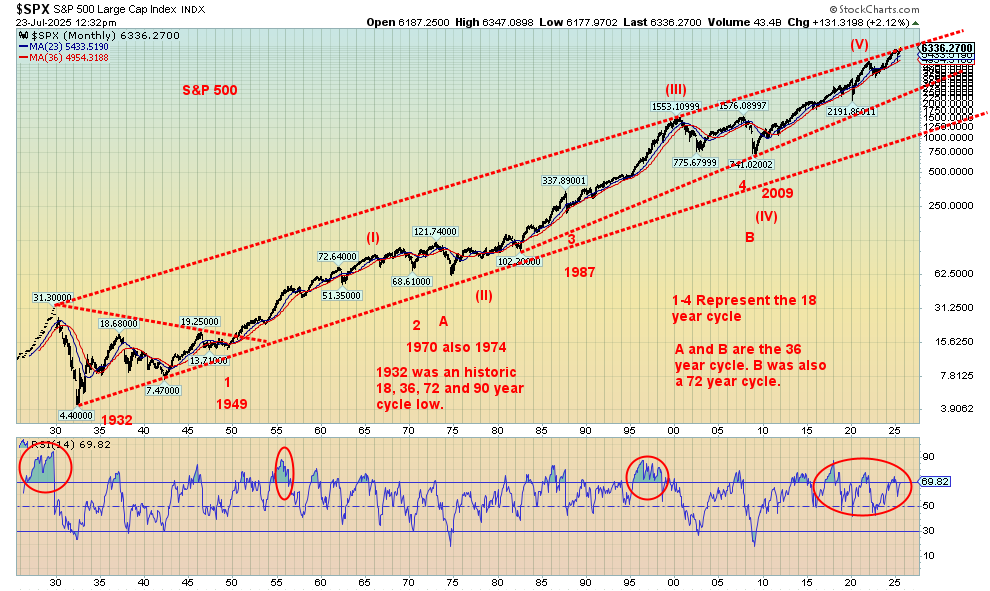
We couldn’t resist showing this chart once again, a 100-year chart of the S&P 500. What’s most striking is that the S&P 500 has been bumping up against the upper trendline channel drawn from the 1929 stock market top, connecting the top in 2000. These were two stock market bubble tops: the Roaring 20s and the dot.com mania. We have been trending along the line for upwards of a year. However, the S&P 500 has not yet broken out above it. Is this another danger sign? The top in 2000 resulted in an eventual loss for the S&P 500 of 53% to the 2009 low. Since then, the S&P 500 is up 755%.
We always follow the cycles. They are not precise, but they do give us a window that may be over a number of years. The ones to watch closely are as follows:
- 90-year cycle, due 2007–2037; last one was in 1932 (rare and few observations)
- 72-year cycle, due 2069–2093; last one was in 2009
- 36-year cycle, due 2039–2051; last one was in 2009
- 18-year cycle, due 2024–2030; last one was in 2009
- 9-year cycle, due 2027–2031; last one was in 2020
- 6-year cycle, due 2027–2030; last one was in 2022
- 3-year cycle, due 2025–2026; last one was in 2022
The most devastating one is the 90-year cycle. But, given there have been only two observations since the birth of the U.S. in 1776, many question its existence. (Note: there was an important stock market low in 1761, 82 years earlier than the 1843 low. There was also a deep depression in the late 1700s.) The first accepted 90-year cycle low was in 1843 (82 years from 1761) and a deep depression known as the “Hungry Forties.” The next one was in 1932 (89 years) with the Great Depression. Better known is the 72-year cycle that last bottomed in 2009 (77 years from 1932; also, the 2002 low was 70 years from 1932). The next one is not due for some time. Ditto the 36-year half-cycle that won’t come until the 2040s.
More pertinent is the 18-year cycle, which is due sometime now up to 2030, the 9-year cycle due soon up to 2031, the 6-year cycle due 2027-2030, and the 3-year cycle due now. What’s key here is that, given a few years’ differential, we are moving into the periods of the 18-, 9-, 6-, and 3-year cycle lows while in the midst of the 90-year cycle low. All are overlapping. What could go wrong when we are looking at a record-breaking stock market? Is everything coming together at the same time?
We are living in an increasingly dangerous world. Income inequality is driving class conflicts. The effects of the One Big, Beautiful Bill have not even entered the economy yet. However, its impact will be great, given the huge benefits that will accrue to high-income earners at the expense of low-income ones. You could see a rising stock market (where does all that money go?), along with rising unemployment and poverty, and rising household debt.
The world continues to experience geopolitical tensions in Eastern Europe (Russia/Ukraine), the Middle East/ Israel, and just about everywhere else, and China, with its expansionary efforts. And in between is the U.S., trying to redefine its role in world politics. Economic fragmentation is underway with tariffs and trade wars.
Bilateral agreements are replacing multilateral agreements.
Curbs on immigration against the backdrop of an aging demographic could continue to drag on economic growth. Immigrants take jobs no one else wants, and they also pay taxes. The deportation raids have instilled fear into the immigrant communities in the U.S. Blueberries are rotting in the fields because there is no one to pick them.
There is little to no control over the debt that just keeps on rising at $37 trillion and counting. The One Big, Beautiful Bill could see upwards of $4 trillion deficits annually. And does it take into account lost revenue due to deportations? Rising debt is not just a problem for governments of all stripes but also for households and corporations.
Extreme weather events are a negative, and the costs to deal with them have been rising steadily. Add in the economic costs of people who lose their jobs, homes, and more. Many do not have insurance. This has the potential to disrupt agriculture, access to water, and supply chains. Given deportations of immigrants, where will the workers come from to rebuild? Inflation is sparking a rise in costly repairs and replacements of structures. Energy demand is growing, raising the need for all sorts of energy sources and not relying on oil and gas only. AI demand is a driving force behind rising energy demands.
Then there is the bond market, which many are no longer viewing as the safe haven it used to be. Threats against the BRIC nations are undermining trust in the U.S. Foreign demand for U.S. securities is waning. China continues to offload securities while the U.K., Canada, and a few others try to pick up the slack. But this just puts more pressure on the U.S. Treasury, given its huge needs. More companies are falling into junk bond territory, and governments threaten to push them aside to satisfy their needs. The risk of further bankruptcies and sovereign defaults is rising.
The Epstein file scandal and potential cover-up have caught our attention. We remember the Watergate scandal and cover-up. The scandal first broke in June 1972. Stock markets topped in January 1973. However, the collapse didn’t get underway until October 1973, spurred on by what was known as the Saturday night massacre and the Arab oil embargo. Does this scandal and cover-up follow a similar path? If so, the collapse might not get underway until later in 2026.
Last but not least is the enormous split and polarization in society. This is occurring everywhere, particularly in the U.S., but also in the EU and even in Canada. Trust is breaking down, and threats of violence are rising. Will it lead to something worse?
No wonder we believe the safe haven asset to own is gold, as well as silver and platinum.
S&P 500
Source: www.stockcharts.com
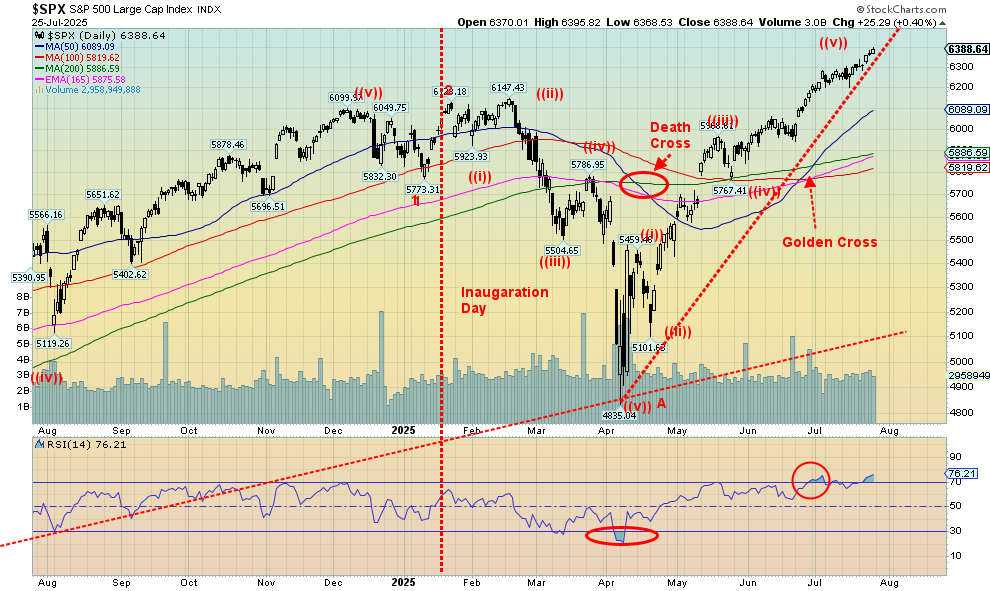
The stock market keeps on trucking higher and higher, smashing records along the way. Okay, at least the S&P 500 and the NASDAQ are doing it. The Dow Jones Industrials (DJI) and the Dow Jones Transportation (DJT)? Not so much. Oh yes, there were a few others making all-time highs, including the Dow Jones Utilities (DJU), the NYSE, the AMEX (yes, the AMEX), the NASDAQ 100, the S&P 100, and the Wilshire 5000. Also, the Russell 1000 and 3000 made all-time highs. But, with all this happening, the DJI doesn’t make all-time highs? Is this a divergence? It should be noted that the S&P 500 and the NASDAQ are both dominated by the MAG7. The DJI is not. Only Apple and Microsoft are a part of the MAG7 and the DJI. The big winner, Nvidia, is not a part of DJI.
On the week, the S&P 500 gained 1.5%, the DJI was up 1.3%, the DJT was up 3.2% but still badly lags the DJI, and the NASDAQ gained 1.0%. The S&P 400 (Mid) was up 1.5% and the S&P 600 (Small) gained 0.9%. Neither index is anywhere near its all-time highs. The S&P 500 Equal Weight Index was up 1.9% but remains short of new highs. The NY FANG Index made all-time highs, up 1.0%.
In Canada, the TSX continues its run to new all-time highs, up 0.7% while the TSX Venture Exchange (CDNX) was up 0.4% to new 52-week highs. Bitcoin fell 0.5%. As to the TSX, making new all-time highs were Consumer Discretionary (TCD), Financials (TFS), Golds (TGD), Metals & Mining (TGM), Materials (TMT), and Utilities (TUT).
A happy week all around.
In the EU, the London FTSE made all-time highs, up 2.6%, the EuroNext gained 0.2%, the Paris CAC 40 was up 0.2%, but the German DAX fell 0.3% as recessionary signs abound for the EU. In Asia, China’s Shanghai Index (SSEC) was up 1.7%, the Tokyo Nikkei Dow (TKN) made all-time highs, up 4.1%, while Hong Kong’s Hang Seng (HSI) was up 2.3%, making new 52-week highs. Overall, a good week for stock markets around the world. What, us worried? Seems not. Lots of money around, it seems. The MSCI World Market made all-time highs, up 0.8%.
Members of the NY FANG Index making all-time highs were Microsoft, Nvidia, and Broadcom. All three are also part of the MAG7.
We noted this past week that the CDNX appears to be breaking out of a long-term downtrend line dating from the 2007 all-time high. We’d like to see more evidence that’s the case to confirm a breakout. Over 850/900 would do the trick. If that’s correct, that’s good news for the long-languishing junior mining stocks.
Nothing seems to be stopping this market. The golden cross seen back in June quickly reversed the death cross seen in April. It does happen, even as we know it’s rare, as trends usually stay in place for some time. Nonetheless, we see this as the fifth wave up from the April lows, so a top could occur anytime. We are also overbought by a number of measurements. Momentum is fading, even as the market is registering extreme greed. August and September are the two worst months of the year, and we are headed into them on an overbought upward trajectory. It’s a warning: caveat emptor. The first sign of trouble wouldn’t occur until we are back under 6,200.
The Scorecard
Source: www.stockcharts.com
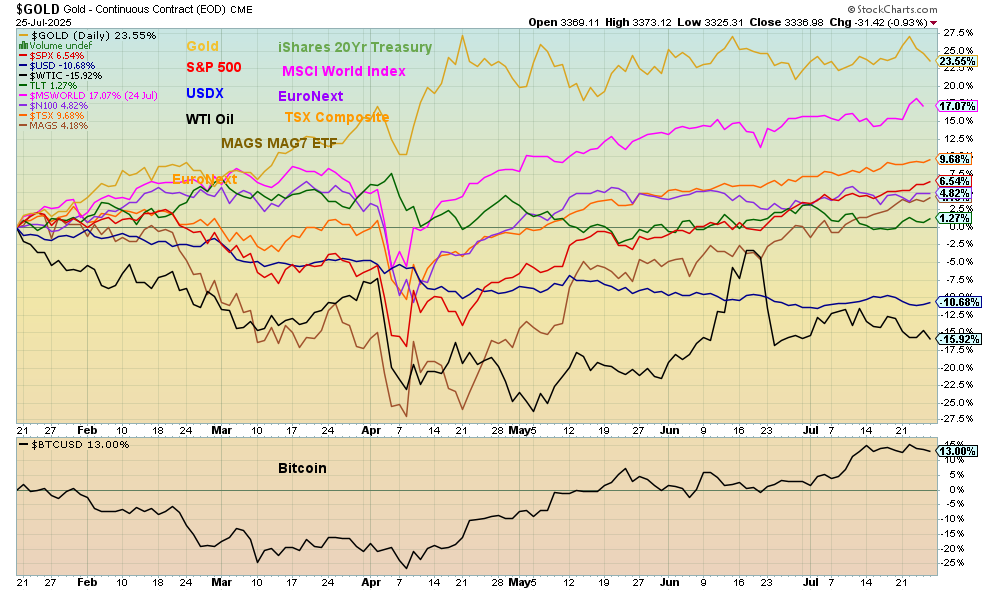
Despite a mildly down week, gold is still in the lead since Inauguration Day on January 20, 2025; it’s up 23.6%. And as to the worst performer, WTI oil remains down 15.9%. Weak oil prices are not conducive to “drill, baby, drill.” The MSCI World Markets Index remains in second place, up 17.1%. Most have recovered and are now up since January 20, but the US$ Index remains weak, down 10.7%.
Bonds
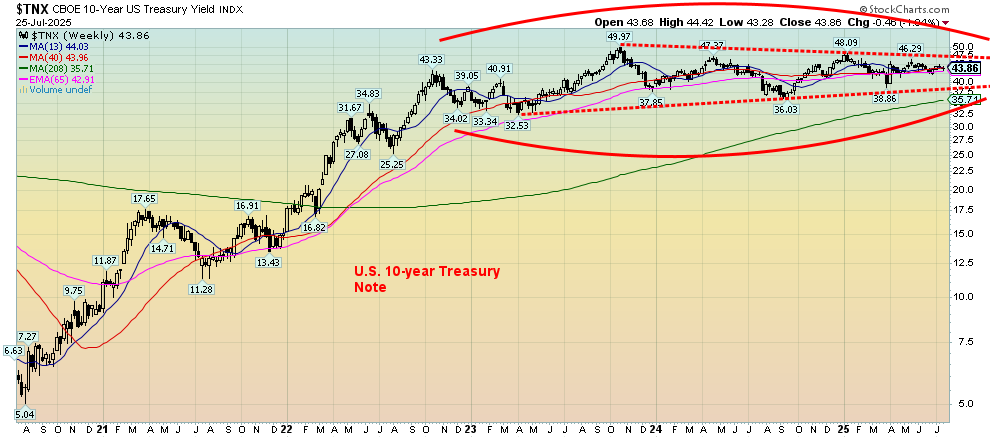
Source: www.stockcharts.com
Talk about ambiguity. The 10-year Treasury note is not telling us what the next move could be, at least not from the technical side. Many believe that bond yields will fall, while others believe bond yields will rise. The chart is not helping us. Symmetrical triangles can be either a topping pattern or a consolidation pattern. If a topping pattern, the 10-year will crack under 3.75%, targeting potentially down to 2.35%. But if it’s a consolidation pattern, we would break to the upside. Over 4.75% could then potentially target up to 6.15%. We’re not sure either target is achievable. However, to end the ambiguity, we must be under 3.75% or over 4.75%. Then we’ll know whether bond yields are going to rise or fall. The arguments are good either way.
If the Fed were to cut rates and there are further signs of recession, bond yields should fall. A falling CPI could also help yields fall. However, if inflation were to move higher and we continue to see reasonable economic growth, that could help yields rise. The US’s huge demands for funds to finance its huge deficits could also put upward pressure on bond yields. As well, signs that at least some foreign entities are not buying U.S. bonds or are unloading them put more pressure on other central banks to pick up the slack or force the Fed to buy bonds. U.S. bonds are not viewed as the safe haven they used to be, which could put upward pressure on bond yields.
Yes, it’s all ambiguous. Await the breakout to tell us the next direction.
Gold
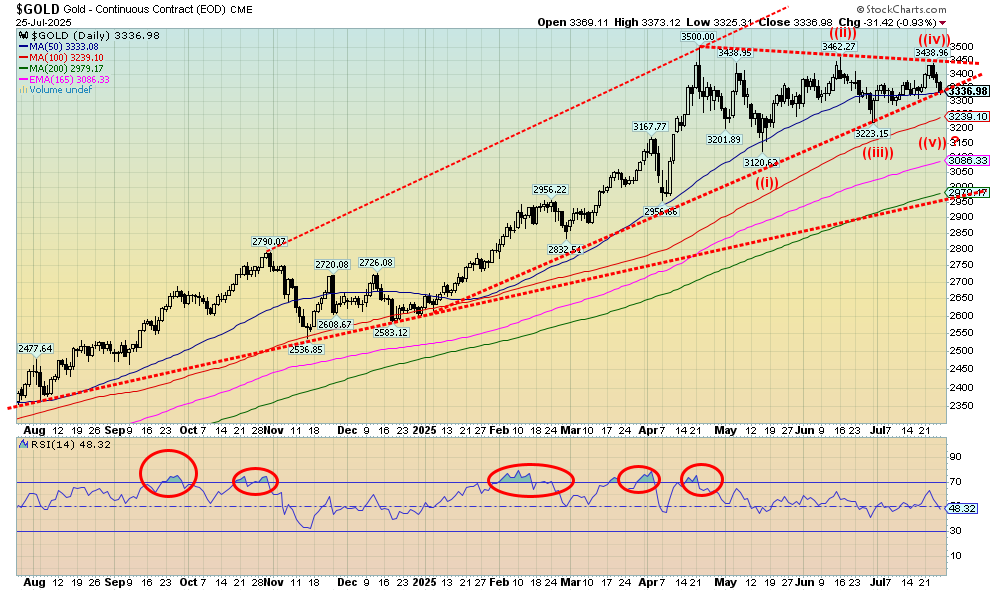
Source: www.stockcharts.com
A pause week for gold? Or was it? This week, we saw gold fall a little, but gold stocks rose nicely. We are still trying to understand the pattern that appears to be forming. It appears as a five-point 1,2,3,4,5 reversal pattern. That suggests to us that the next move should be up. But we haven’t convinced ourselves of that yet. Thus, the ambiguity of symmetrical triangles. Is it a consolidation pattern or a topping pattern? We continue to believe it’s the former, but to convince us, we need to see new highs above $3,500. So far, we’re not getting that, even as silver, platinum, and copper made new 52-week highs this past week. It all suggests that gold should follow. The RSI indicator is pretty neutral here, so it also is not giving us much of a clue as to the next move.
Gold fell a small 0.4% this past week. The drivers were the ongoing trade deals announced by the White House, thus easing the thoughts of trade wars, and Trump downplaying his attacks on Fed Chair Jerome Powell. It all helped the US$ Index rise and lessened the need for safe havens such as gold. Silver was flat while platinum fell 1.3%. That was despite both metals making fresh 52-week highs. Palladium was down 2.1% but copper (a leading indicator, in our opinion) was up 4.1% to new all-time highs. Then the real counter came as we noted the gold stocks were up nicely on the week. The Gold Bugs Index (HUI) rose 5.1% while the TSX Gold Index (TGD) gained 5.8%. The HUI made 52-week highs while the TGD made all-time highs.
The strong gold stock market, even as gold itself fell, tells us that the next move should be up for gold and that $3,500 should eventually fall. Our caveat would be for gold to fall under $3,300 and especially under $3,200. That signals to us that this current corrective period could be longer and deeper, pushing potential lows out into August or even September. August is more likely, but we’ll have to wait and see. That the gold stocks rose this past week suggests they don’t believe in gold’s fall this past week. That was especially noticeable on Friday when gold fell 0.9% but the HUI rose 0.8% and the TGD was up 1.7%.
We’re with the gold stocks on this one.
Copyright David Chapman 2025
Markets & Trends
|
|
|
|
% Gains (Losses) Trends |
|
||||
|
|
Close Dec 31/24 |
Close Jul 25/25 |
Week |
YTD |
Daily (Short Term) |
Weekly (Intermediate) |
Monthly (Long Term) |
|
|
|
|
|
|
|
|
|
||
|
S&P 500 |
5,881.63 |
6,388.64 (new highs) * |
1.5% |
8.6% |
up |
up |
up |
|
|
Dow Jones Industrials |
42,544.22 |
44,901.92 |
1.3% |
5.5% |
up |
up |
up |
|
|
Dow Jones Transport |
16,030.66 |
16,364.84 |
3.2% |
3.0% |
up |
up (weak) |
up |
|
|
NASDAQ |
19,310.79 |
21,108.32 (new highs) * |
1.0% |
9.3% |
up |
up |
up |
|
|
S&P/TSX Composite |
24,796.40 |
27,494.35 (new highs) * |
0.7% |
11.2% |
up |
up |
up |
|
|
S&P/TSX Venture (CDNX) |
597.87 |
801.13 (new highs) |
0.4% |
34.4% |
up |
up |
up |
|
|
S&P 600 (small) |
1,408.17 |
1,377.40 |
0.9% |
(2.2)% |
up |
neutral |
up |
|
|
MSCI World |
2,304.50 |
2,727.54 (new highs) * |
0.8% |
18.4% |
up |
up |
up |
|
|
Bitcoin |
93,467.13 |
118,077.77 |
(0.5)% |
26.3% |
up |
up |
up |
|
|
|
|
|
|
|
|
|
|
|
|
Gold Mining Stock Indices |
|
|
|
|
|
|
|
|
|
Gold Bugs Index (HUI) |
275.58 |
442.53 (new highs) |
5.1% |
60.6% |
up |
up |
up |
|
|
TSX Gold Index (TGD) |
336.87 |
520.17 (new highs) * |
5.8% |
54.4% |
up |
up |
up |
|
|
|
|
|
|
|
|
|
|
|
|
% |
|
|
|
|
|
|
|
|
|
U.S. 10-Year Treasury Bond yield |
4.58% |
4.39% |
(0.7)% |
(4.2)% |
|
|
|
|
|
Cdn. 10-Year Bond CGB yield |
3.25% |
3.53% |
(1.4)% |
8.6% |
|
|
|
|
|
Recession Watch Spreads |
|
|
|
|
|
|
|
|
|
U.S. 2-year 10-year Treasury spread |
0.33% |
0.45% |
(16.7)% |
36.4% |
|
|
|
|
|
Cdn 2-year 10-year CGB spread |
0.30% |
0.72% |
(5.3)% |
140.0% |
|
|
|
|
|
|
|
|
|
|
|
|
|
|
|
Currencies |
|
|
|
|
|
|
|
|
|
US$ Index |
108.44 |
97.67 |
(0.8)% |
(9.9)% |
down |
down |
down |
|
|
Canadian $ |
69.49 |
0.7297 |
0.1% |
5.0% |
up |
up |
neutral |
|
|
Euro |
103.54 |
117.46 |
1.0% |
13.4% |
up |
up |
up |
|
|
Swiss Franc |
110.16 |
125.74 |
0.8% |
14.1% |
up |
up |
up |
|
|
British Pound |
125.11 |
134.36 |
0.2% |
7.4% |
up |
up |
up |
|
|
Japanese Yen |
63.57 |
67.73 |
0.7% |
6.5% |
down |
up (weak) |
down (weak) |
|
|
|
|
|
|
|
|
|
|
|
|
|
|
|
|
|
|
|
|
|
|
Precious Metals |
|
|
|
|
|
|
|
|
|
Gold |
2,641.00 |
3,336.98 |
(0.4)% |
26.4% |
up |
up |
up |
|
|
Silver |
29.24 |
38.16 (new highs) |
flat |
30.5% |
up |
up |
up |
|
|
Platinum |
910.50 |
1,417.30 (new highs) |
(2.1)% |
38.5% |
up |
up |
up |
|
|
|
|
|
|
|
|
|
|
|
|
Base Metals |
|
|
|
|
|
|
|
|
|
Palladium |
909.80 |
1,260.00 |
(2.1)% |
38.5% |
up |
up |
neutral |
|
|
Copper |
4.03 |
5.78 (new highs) * |
4.1% |
43.4% |
up |
up |
up |
|
|
|
|
|
|
|
|
|
|
|
|
Energy |
|
|
|
|
|
|
|
|
|
WTI Oil |
71.72 |
65.07 |
(3.3)% |
(9.3)% |
down (weak) |
down |
down |
|
|
Nat Gas |
3.63 |
3.09 |
(13.5)% |
(14.9)% |
down |
down |
down (weak) |
|
Source: www.stockcharts.com
* New All-Time Highs
Note: For an explanation of the trends, see the glossary at the end of this article.
New highs/lows refer to new 52-week highs/lows and, in some cases, all-time highs.
GLOSSARY
Trends
Daily – Short-term trend (For swing traders)
Weekly – Intermediate-term trend (For long-term trend followers)
Monthly – Long-term secular trend (For long-term trend followers)
Up – The trend is up.
Down – The trend is down
Neutral – Indicators are mostly neutral. A trend change might be in the offing.
Weak – The trend is still up or down but it is weakening. It is also a sign that the trend might change.
Topping – Indicators are suggesting that while the trend remains up there are considerable signs that suggest that the market is topping.
Bottoming – Indicators are suggesting that while the trend is down there are considerable signs that suggest that the market is bottoming.
Disclaimer
David Chapman is not a registered advisory service and is not an exempt market dealer (EMD) nor a licensed financial advisor. He does not and cannot give individualised market advice. David Chapman has worked in the financial industry for over 40 years including large financial corporations, banks, and investment dealers. The information in this newsletter is intended only for informational and educational purposes. It should not be construed as an offer, a solicitation of an offer or sale of any security. Every effort is made to provide accurate and complete information. However, we cannot guarantee that there will be no errors. We make no claims, promises or guarantees about the accuracy, completeness, or adequacy of the contents of this commentary and expressly disclaim liability for errors and omissions in the contents of this commentary. David Chapman will always use his best efforts to ensure the accuracy and timeliness of all information. The reader assumes all risk when trading in securities and David Chapman advises consulting a licensed professional financial advisor or portfolio manager such as Enriched Investing Incorporated before proceeding with any trade or idea presented in this newsletter. David Chapman may own shares in companies mentioned in this newsletter. Before making an investment, prospective investors should review each security’s offering documents which summarize the objectives, fees, expenses and associated risks. David Chapman shares his ideas and opinions for informational and educational purposes only and expects the reader to perform due diligence before considering a position in any security. That includes consulting with your own licensed professional financial advisor such as Enriched Investing Incorporated. Performance is not guaranteed, values change frequently, and past performance may not be repeated.
Read the full article here