A shortened report as we had a minor operation earlier in the week and it laid us up. This week we’re off to Ottawa so it’ll be another shortened report.
Markets continue to climb but it’s the DJI that makes new all-time highs along with a few others including the TSX. But the other main indices i.e. S&P 500, NASDAQ did not. A divergence?
There were few numbers this past week but the ones that did come out surprised by being somewhat stronger. But will it continue? That helped move the US$ Index higher which negatively impacted gold and finished the week off small.
Golds continue to look strong and we are moving into a stronger period for them. Lundin Gold Inc., a gold exploration and production company held in the Enriched Capital Conservative Growth Strategy,* for example, reported that strong grades, improved recoveries, eliminated debt, and high throughput underpinned increased revenue and income, strong cashflow, and a doubled dividend. And we’re moving into a weaker period for stocks. Be defensive? September is the worst month of the year for stocks. The inverted yield curve is getting smaller, signaling we are getting closer to a recession.
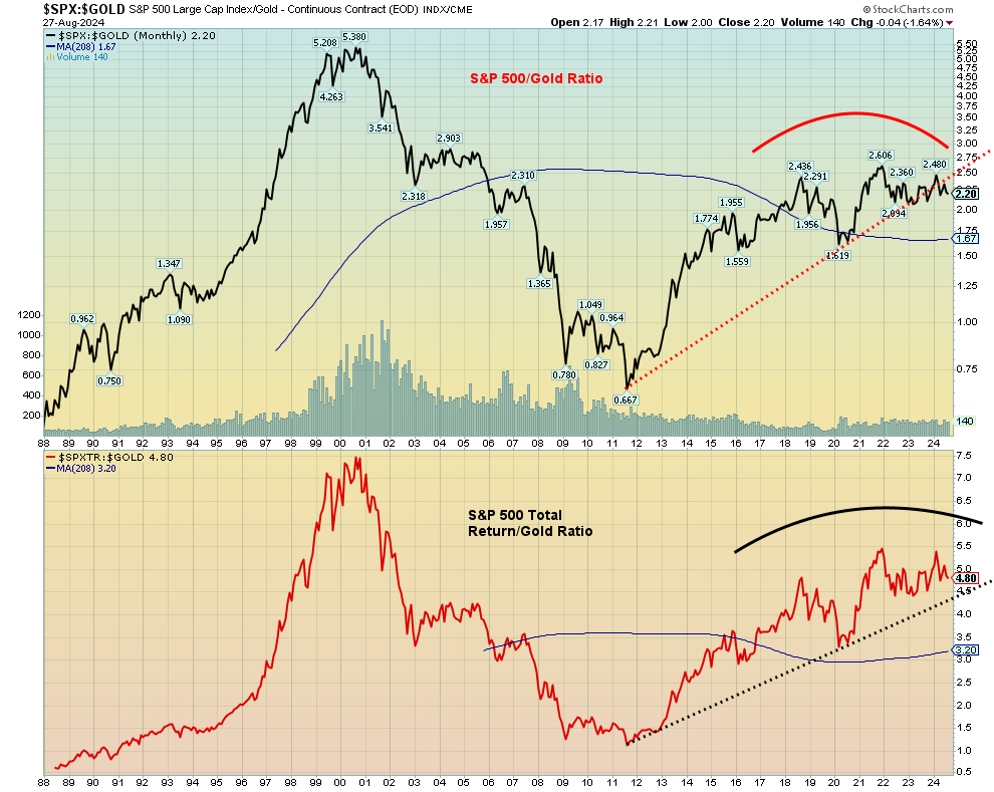
An interesting chart of the week where we look at the S&P 500 in terms of gold then also look at the S&P 500 total return in terms of gold. Bit of a difference as you will see.
This Friday brings us the August job numbers for both Canada and the U.S. They are looking for subdued reports in both countries.
Have a great week.
DC
* Reference to the Enriched Capital Conservative Growth Strategy and its investments, celebrating a 6-year history of strong growth, is added by Margaret Samuel, President, CEO, and Portfolio Manager of Enriched Investing Incorporated, who can be reached at 416-203-3028 or [email protected]
“I’m not better than the next trader, just quicker at admitting my mistakes and moving on to the next opportunity.”
—George Soros, Hungarian-American investor/financier, philanthropist, best known as the man who broke the Bank of England, Soros Fund/Quantum Fund, his support of progressive and liberal political causes has drawn ire from far right-wing groups, including numerous conspiracy theorists; b. 1930
“Success isn’t measured by the position you reach in life, it’s measured by the obstacles you overcome.”
—Booker T. Washington, American educator, author, orator, leader of African-American community, born into slavery, leader of Tuskegee Institute of Alabama, autobiography Up from Slavery (1901); 1856–1915
“The years teach much which the days never know.”
—Ralph Waldo Emerson, American essayist, lecturer, philosopher, abolitionist, leader of the Transcendentalist movement, mid-19th century, went by middle name Waldo; 1803–1882
Labour Day weekend marks the unofficial end of summer. We leave the summer doldrums behind. But once Labour Day is behind us, the stock markets can often enter a season fraught with dangers. The most famous top in stock markets occurred on September 3, 1929. What followed was an 89% collapse of the Dow Jones Industrials (DJI) into July 1932 and the onset of the Great Depression. No, we are not expecting a replay of that period, but like 1929, stock markets have been rising into September. However, September often brings portfolio managers wishing to clear out the dead wood to prepare themselves for better days ahead.
September is known as the worst month of the year for stock markets. Since 1950, the DJI has experienced only 12 up years and 44 down years in September. The odds are not good that will change this year, given we are rising into the period. Oh, sometimes we hang on like we did in 2007. The top that year was in October. Then came the financial crisis of 2008 as markets experienced a 54% decline into March 2009 and the Great Recession. Or we might top early as we did in August 1987 before the worst crash in history came in October. Obviously, we are past that point. Such is the frailty of the period. Since 1900 we have seen six significant September tops, each followed by a nasty drop. Only one top was seen in August or October. Will this year be different?
We doubt it, as the background is anything but friendly. Yes, so far, markets appear to be ignoring the topping of the Magnificent 7, the wars, the extremely divisive election that could descend into violence if the results aren’t what people expect, and a slowing but still reasonably robust economy. Indeed, the U.S. economy has been the best of the G7. Even Canada’s latest results show we are far from broken. Wobbly yes, but not broken. But then, compared to the EU, the U.K., and Japan, Canada is doing fine.
So maybe it’s no surprise that, despite the summer doldrums, August was still a positive month. The S&P 500 (SPX) gained 2.3%, the DJI 1.8%, and the NASDAQ a feebler 0.7% thanks to the Mag7 finally wobbling as the NY FANG Index lost 0.6%. And the Dow Jones Transportations (DJT) lost too, off 0.3%. In Canada, the TSX Composite was up 1.0% but the small-cap TSX Venture Exchange (CDNX) was down 2.5%. The CDNX can’t seem to get out of the way of itself, but the junior developers that dominate the index have the most compelling potential. Gold continues to shine, up 2.2%, and silver gained 0.7%. WTI oil lost 5.6% but Natural Gas (NG) gained 4.5%. The gold stocks, represented by the TSX Gold Index (TGD), were up 0.7%.
Source: www.stockcharts.com
The bull markets continue. The DJI once again made all-time highs. But, again, it was the only major U.S. index to do so. A significant divergence? Oh, the SPX is close. Maybe this week? On the week, the SPX gained 0.2%, the DJI 0.9%, and the DJT 0.5% but it continues to be nowhere near its former highs, a continuing Dow Theory non-confirmation with the DJI. The NASDAQ lost 0.9%. The junior S&P 400 (Mid) fell 0.2% while the S&P 600 (Small) was flat. The S&P 500 Equal Weight Index has been outperforming, making new all-time highs and up 0.8%. The NY FANG Index, led by Nvidia dropping 7.7%, fell 1.8%.
In Canada, the TSX also made new all-time highs, up 0.3% on the week, but the CDNX was hit again, down 1.8%. Overseas in the EU, the London FTSE was up 0.5%, the EuroNext up 1.0%, the Paris CAC 40 up 0.7%, while the German DAX made all-time highs, up 1.5%. Bullishness remains in the EU. In Asia, China’s Shanghai Index (SSEC) fell 0.4% as the Chinese economy continues to wobble. The Tokyo Nikkei Dow (TKN) was up 0.7% as was Hong Kong’s Hang Seng (HSI). The MSCI World Index continued its run with new all-time highs, up 1.4%.
Bitcoin continues to look like it has topped as it fell 7.4%.
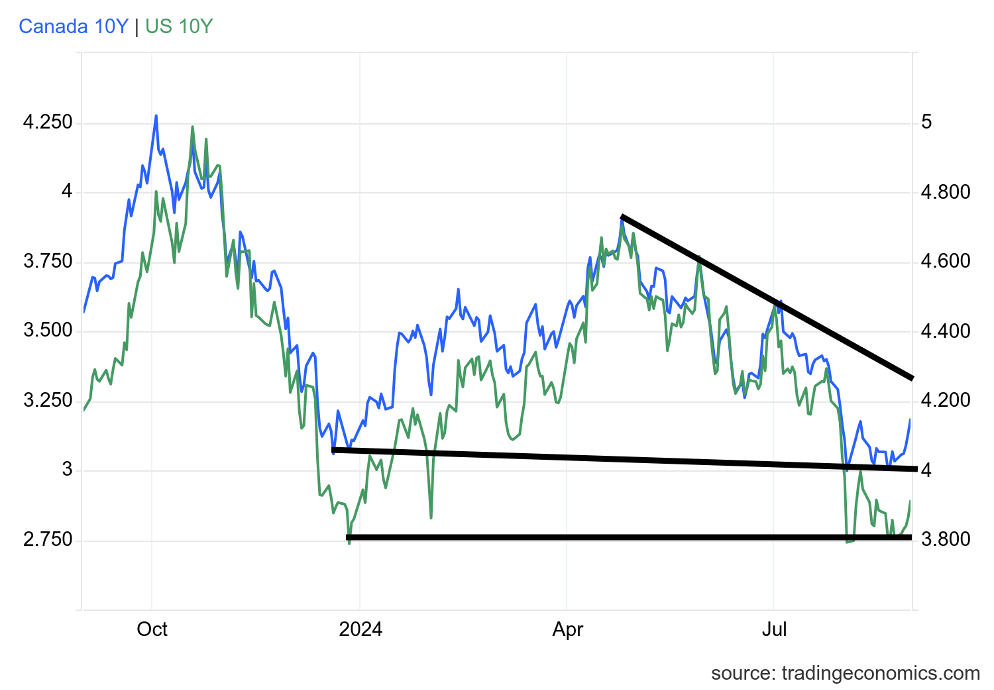
U.S. 10-year Treasury Note, Canada 10-year Bond CGB
 Source: www.tradingeconomics.com, www.home.treasury.gov, www.bankofcanada.ca
Bond yields backed up as both Canada and the U.S. reported better than expected Q2 GDP growth rates. Canada gained 2.1% annualized after expecting only 1.5%, while the U.S. was up 3% after expecting 2.8%. Those are decent numbers, even if some other numbers behind weren’t as good. PCE prices, the Fed’s favourite price index were fine, coming in at an expected 2.5%. Wobblier was the Chicago PMI at a recessionary 46.1, while consumer sentiment is still low at 67.9, about as expected.
The result saw the U.S. 10-year treasury note back up to 3.91% from 3.81% and Canada’s 10-year Government of Canada bond (CGB) up to 3.18% from 3.05%. Recessionary signs heightened, however, as the 2–10 U.S. spread fell to the lowest in some time at negative 2 bp from negative 13 bp and Canada’s 2–10 was down to negative 18 bp from negative 29 bp. Is a positive yield curve next? It heightens the odds of a recession starting soon as it may be that the best numbers are behind us.
Note how bond yields may have hit a significant support zone in both U.S. and Canada. That suggests we may be about to start an up cycle in long rates again. What drives it? Amongst other things, it is foreign selling of U.S. treasuries. More are becoming reluctant to hold U.S. securities because the U.S. has sanctioned so many and they fear they are next. As well the seizing of Russia’s assets and threatening to use them for Ukraine has rattled numerous countries. To be safe – don’t hold U.S. securities. China, in particular, continues to divest itself of U.S. treasuries. Also, the BRICS are meeting to once again create their own currency, their own IMF and World Bank, and SWIFT payment system, all of which are dominated by the U.S.
The S&P 500 is approaching a decision. Does it go to new all-time highs or fail here? There is still room in that channel to make higher levels. Is the past week’s sideways action a platform or a plateau? If a platform, it breaks under 5,565. If a plateau, it takes out this week’s high and moves higher. But the real sign of a top doesn’t come until we break under 5,500. Most indicators are flashing warning signs as it shows complacency. Negative divergences are not uncommon. Safety is paramount as we move into the worst month of the year.
 Source: www.stockcharts.com
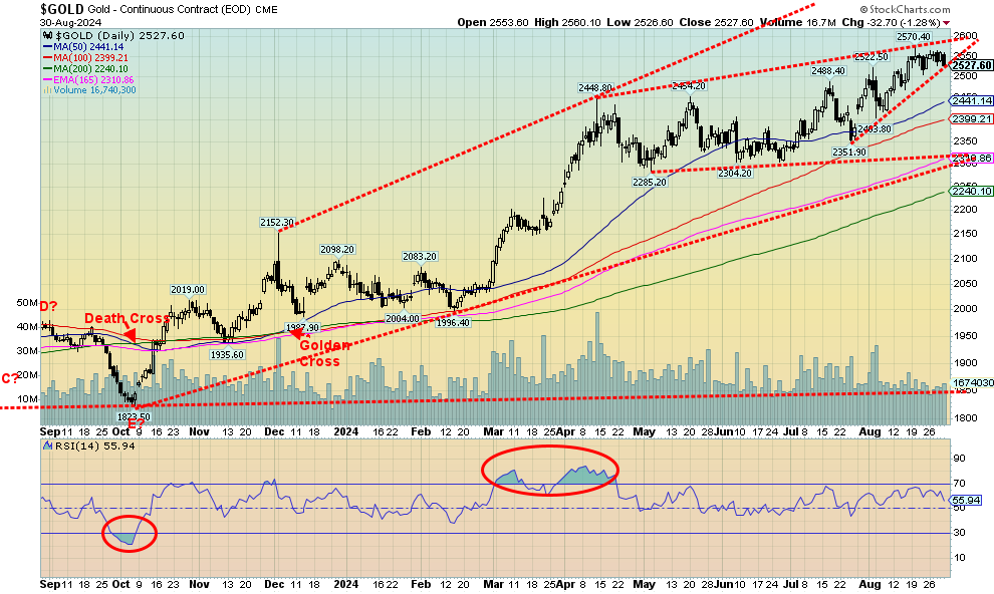
Gold continues to shine, even though it still seems no one is paying any attention. It has been described as the canary in the coal mine, warning us that something negative is afoot. Too bad silver is still struggling to get the message. But we did see some positive moves by silver over the past couple of weeks. This past week gold fell 0.7%, thanks to a strong U.S. dollar as the US$ Index, sparked by the better-than-expected economic numbers, rose 1.0%. Silver fell 2.3%. But gold remains up 22.0% on the year and silver up 21.0%. Platinum continues to struggle, falling 3.5%, but palladium continues to recover, up 2.2%, while copper was up 0.2%. The gold stocks suffered as a result, with the Gold Bugs Index (HUI) falling 2.0% and the TSX Gold Index (TGD) off 1.5%. Both remain up on the year at 28.7% and 27.7% respectively.
Gold is still rising, but below $2,500 a temporary top may be in. We still seem to be headed inexorably for $2,600 next. There is good support down to $2,400. Silver has support here at $29, but below that we could fall to $28. The TGD has good support down to 347 and 340. We may not have made a seasonal bottom in September yet, so some more work may need to be done on the current corrective state. Once we find a bottom, we could rise into November before correcting again into December. After that, gold enjoys its best seasonal pattern of the year with good rises into March.
A quick note on oil that continues to suffer some demand concerns. And with the Middle East relatively quiet, especially on the Iran front, that keeps a lid on oil rising. WTI oil fell 1.7% this past week, Brent was down 1.6%, natural gas (NG) fell 2.3%, but EU NG at the Dutch Hub was up 7.6%. Energy stocks were mixed, with the ARCA Oil & Gas Index (XOI) up 0.7% but the TSX Energy Index (TEN) was down 1.4%. We’re still a couple of months away from the strong seasonals for oil.
Gold is going higher. But we need silver to assume leadership, and it still needs to take out $31.50 to tell us new highs are ahead. In the interim, we still might face some further corrective action. Into 2025 things might get quite golden.
Chart of the Week
 Source: www.stockcharts.com
Most followed is the Dow Jones Industrials/Gold ratio, or simply the DJI/Gold ratio. It is useful in determining whether one should be long stocks or long gold. The ratio showed you should be long gold 1929–1932, 1966–1980, and 1999–2011. And long stocks 1932–1966, 1980–1999, and 2011–2018. It is indeterminate since then as the pattern has moved largely sideways, with some bias towards gold.
However, this looks at the S&P 500/Gold ratio as well as the S&P 500 Total Return/Gold ratio. The patterns and when to be long or short (out of) gold are the same, but the message seems to be that over time the S&P 500 total return has outperformed by more than double. When, as we show below, Chen Zhao’s chart rebased to 1969, it shows it is more than four times better. It shows the power of dividends. What it seems to suggest is that while there is a time to hold gold or even increase one’s exposure to it over the long term, it is better to collect dividends. Both patterns are now indicating that the ratio is topping, suggesting one should increase their exposure to gold.
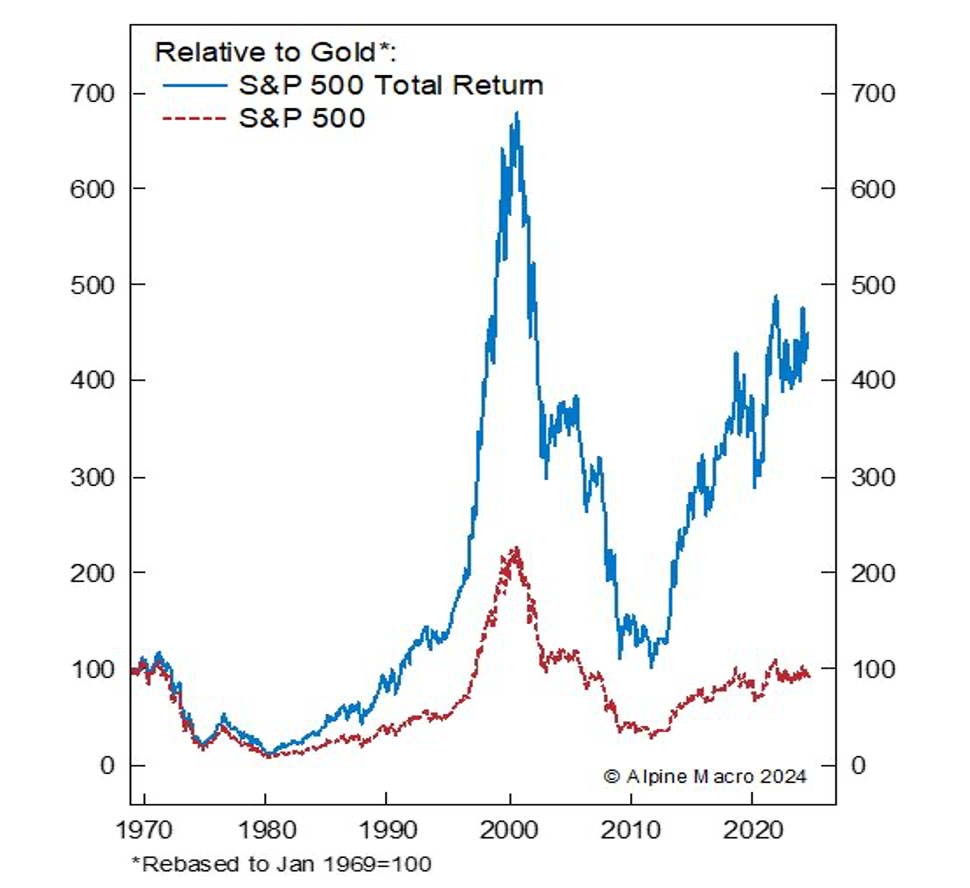 Source: www.alpinemacro.com, courtesy of Chen Zhao
Copyright David Chapman 2024
Markets & Trends
|
|
|
|
% Gains (Losses) Trends |
|
||||
|
|
Close Dec 31/23 |
Close Aug 30, 2024 |
Week |
YTD |
Daily (Short Term) |
Weekly (Intermediate) |
Monthly (Long Term) |
|
|
Stock Market Indices |
|
|
|
|
|
|
|
|
|
S&P 500 |
4,769.83 |
5,648.40 |
0.2% |
18.4% |
up |
up |
up |
|
|
Dow Jones Industrials |
37,689.54 |
41,563.08 (new highs)* |
0.9% |
10.3% |
up |
up |
up |
|
|
Dow Jones Transport |
15,898.85 |
16,043.85 |
0.5% |
0.9% |
up |
up |
up |
|
|
NASDAQ |
15,011.35 |
17,713.62 |
(0.9)% |
18.0% |
up |
up |
up |
|
|
S&P/TSX Composite |
20,958.54 |
23,346.18 (new highs)* |
0.3% |
11.4% |
up |
up |
up |
|
|
S&P/TSX Venture (CDNX) |
552.90 |
567.91 |
(1.8)% |
2.7% |
neutral |
neutral |
down |
|
|
S&P 600 (small) |
1,318.26 |
1,412.57 |
flat |
7.2% |
up |
up |
up |
|
|
MSCI World |
2,260.96 |
2,468.70 (new highs)* |
1.4% |
9.2% |
up |
up |
up |
|
|
Bitcoin |
41,987.29 |
58,850.29 |
(7.4)% |
40.2% |
down |
neutral |
up |
|
|
|
|
|
|
|
|
|
|
|
|
Gold Mining Stock Indices |
|
|
|
|
|
|
|
|
|
Gold Bugs Index (HUI) |
243.31 |
313.20 |
(2.0)% |
28.7% |
up |
up |
up |
|
|
TSX Gold Index (TGD) |
284.56 |
363.23 |
(1.5)% |
27.7% |
up |
up |
up |
|
|
|
|
|
|
|
|
|
|
|
|
% |
|
|
|
|
|
|
|
|
|
U.S. 10-Year Treasury Bond yield |
3.87% |
3.91% |
2.6% |
1.0% |
|
|
|
|
|
Cdn. 10-Year Bond CGB yield |
3.11% |
3.18% |
4.3% |
2.3% |
|
|
|
|
|
Recession Watch Spreads |
|
|
|
|
|
|
|
|
|
U.S. 2-year 10-year Treasury spread |
(0.38)% |
(0.02)% |
84.6% |
94.7% |
|
|
|
|
|
Cdn 2-year 10-year CGB spread |
(0.78)% |
(0.18)% |
37.9% |
76.9% |
|
|
|
|
|
|
|
|
|
|
|
|
|
|
|
Currencies |
|
|
|
|
|
|
|
|
|
US$ Index |
101.03 |
101.69 |
1.0% |
0.7% |
down |
down |
neutral |
|
|
Canadian $ |
75.60 |
74.11 |
0.1% |
(2.0)% |
up |
neutral |
down |
|
|
Euro |
110.36 |
110.47 |
(1.3)% |
0.1% |
up |
up |
up (weak) |
|
|
Swiss Franc |
118.84 |
117.66 |
(0.3)% |
(1.0)% |
up |
up |
up |
|
|
British Pound |
127.31 |
131.27 |
(0.7)% |
3.1% |
up |
up |
up (weak) |
|
|
Japanese Yen |
70.91 |
68.41 |
(1.3)% |
(3.5)% |
up |
up |
down |
|
|
|
|
|
|
|
|
|
|
|
|
|
|
|
|
|
|
|
|
|
|
Precious Metals |
|
|
|
|
|
|
|
|
|
Gold |
2,071.80 |
2,527.60 |
(0.7)% |
22.0% |
up |
up |
up |
|
|
Silver |
24.09 |
29.14 |
(2.3)% |
21.0% |
neutral |
up |
up |
|
|
Platinum |
1,023.20 |
932.20 |
(3.5)% |
(8.9)% |
down |
neutral |
down (weak) |
|
|
|
|
|
|
|
|
|
|
|
|
Base Metals |
|
|
|
|
|
|
|
|
|
Palladium |
1,140.20 |
962.80 |
2.2% |
(15.6)% |
up |
down (weak) |
down |
|
|
Copper |
3.89 |
4.21 |
0.2% |
8.2% |
neutral |
neutral |
neutral |
|
|
|
|
|
|
|
|
|
|
|
|
Energy |
|
|
|
|
|
|
|
|
|
WTI Oil |
71.70 |
73.55 |
(1.7)% |
2.5% |
down |
down (weak) |
down (weak) |
|
|
Nat Gas |
2.56 |
2.13 |
(2.3)% |
(16.8)% |
neutral |
down (weak) |
down |
|
Source: www.stockcharts.com
Note: For an explanation of the trends, see the glossary at the end of this article.
New highs/lows refer to new 52-week highs/lows and, in some cases, all-time highs.
GLOSSARY
Trends
Daily – Short-term trend (For swing traders)
Weekly – Intermediate-term trend (For long-term trend followers)
Monthly – Long-term secular trend (For long-term trend followers)
Up – The trend is up.
Down – The trend is down
Neutral – Indicators are mostly neutral. A trend change might be in the offing.
Weak – The trend is still up or down but it is weakening. It is also a sign that the trend might change.
Topping – Indicators are suggesting that while the trend remains up there are considerable signs that suggest that the market is topping.
Bottoming – Indicators are suggesting that while the trend is down there are considerable signs that suggest that the market is bottoming.
Disclaimer
David Chapman is not a registered advisory service and is not an exempt market dealer (EMD) nor a licensed financial advisor. He does not and cannot give individualised market advice. David Chapman has worked in the financial industry for over 40 years including large financial corporations, banks, and investment dealers. The information in this newsletter is intended only for informational and educational purposes. It should not be construed as an offer, a solicitation of an offer or sale of any security. Every effort is made to provide accurate and complete information. However, we cannot guarantee that there will be no errors. We make no claims, promises or guarantees about the accuracy, completeness, or adequacy of the contents of this commentary and expressly disclaim liability for errors and omissions in the contents of this commentary. David Chapman will always use his best efforts to ensure the accuracy and timeliness of all information. The reader assumes all risk when trading in securities and David Chapman advises consulting a licensed professional financial advisor or portfolio manager such as Enriched Investing Incorporated before proceeding with any trade or idea presented in this newsletter. David Chapman may own shares in companies mentioned in this newsletter. Before making an investment, prospective investors should review each security’s offering documents which summarize the objectives, fees, expenses and associated risks. David Chapman shares his ideas and opinions for informational and educational purposes only and expects the reader to perform due diligence before considering a position in any security. That includes consulting with your own licensed professional financial advisor such as Enriched Investing Incorporated. Performance is not guaranteed, values change frequently, and past performance may not be repeated.
Read the full article here