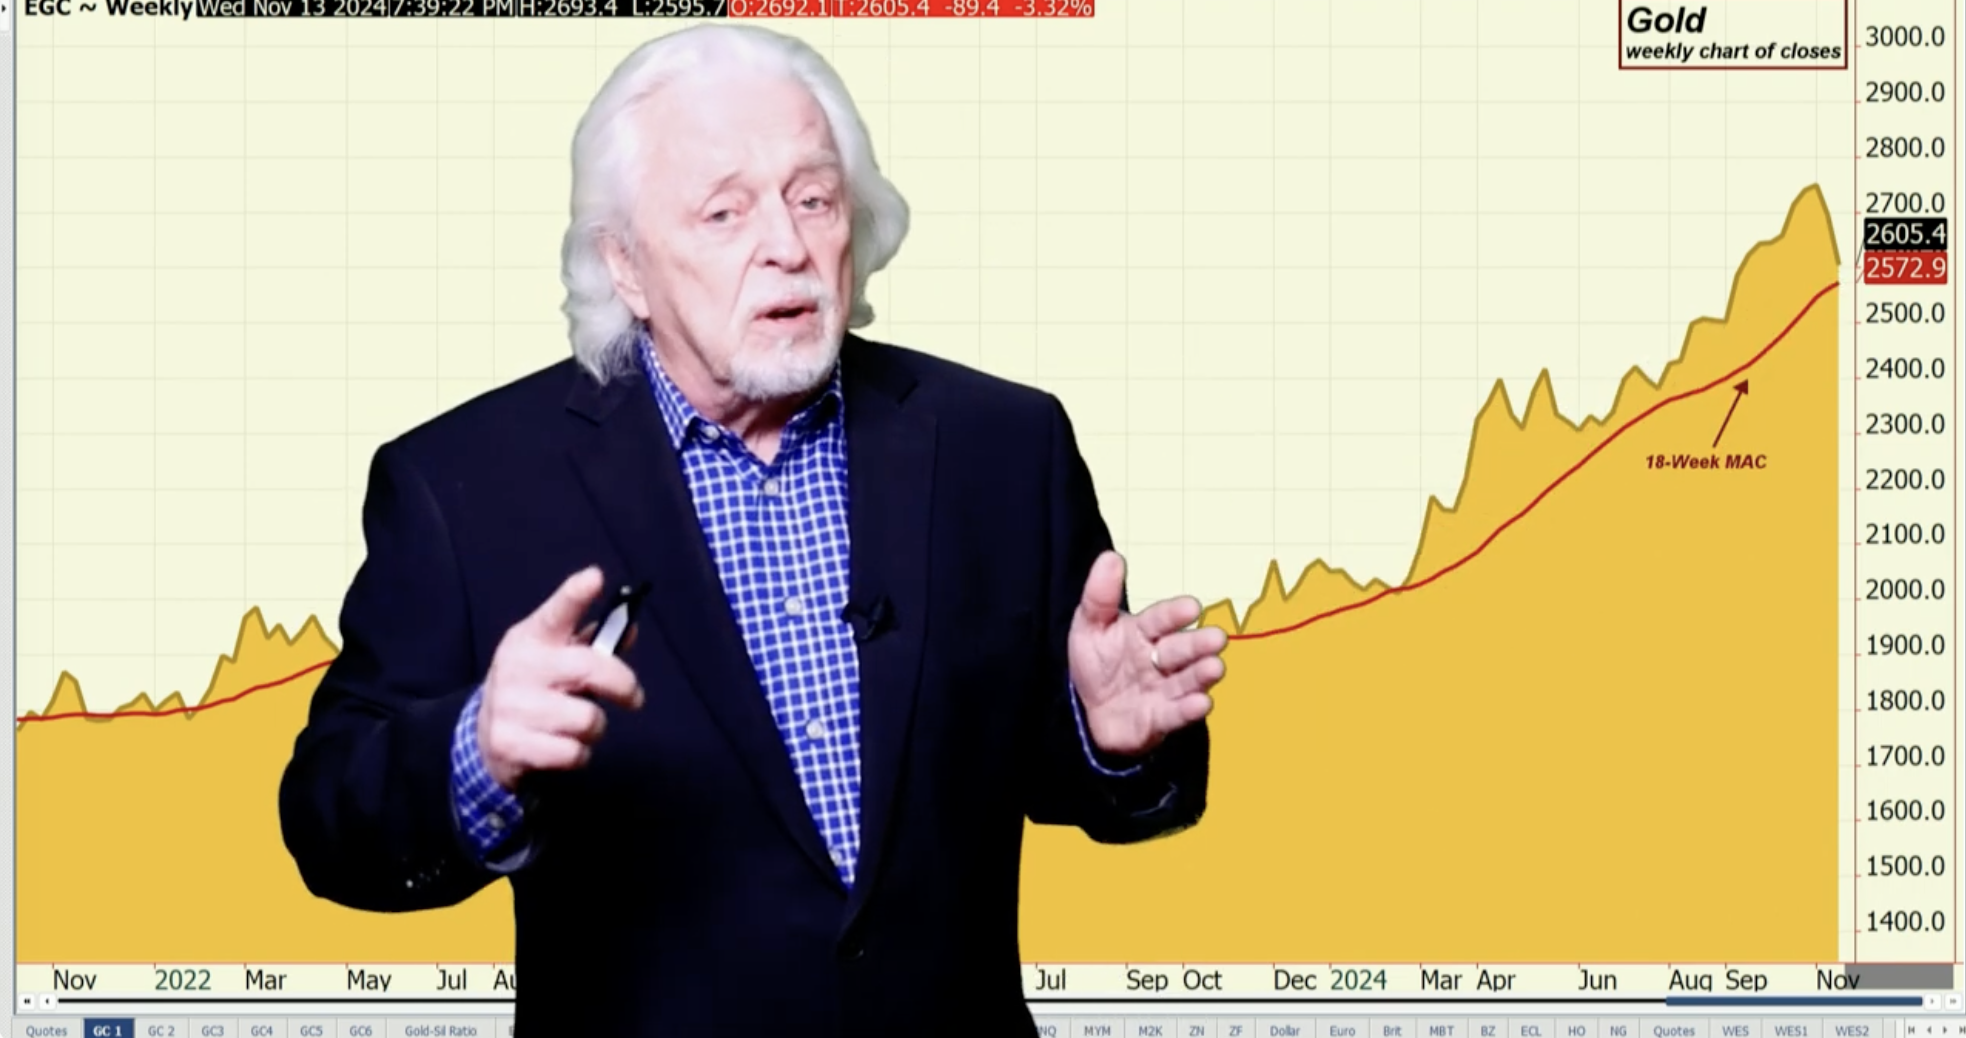
When you look at the gold, on the weekly chart it supports $2572.90. It is higher on the other charts that I’m looking at. So you want to look at that, we will see just where you’re at. When you take a look at the daily chart, you can see that the momentum to the downside, all there. The market coming in right through here. Where’s the Bollinger band bottom? you’re still running it.
If the market extends we look for the possibility of getting into the $2564 level, or the Bollinger Band. You’re under the Bollinger Band today, and you’re under it still tonight. So, the market is extended. It has gone from roughly the $2800 level, as you know $200 an ounce almost, down. And it happened in very fast order in part, due to ideas here that Trump spending is going to cause interest rates to stay higher for longer. And interest rates and a strong dollar work against the gold, and that’s how you look at what has happened.
Read the full article here

