

The gold bull run of the 1970s started with a default when the US defaulted on its gold obligations in August of 1971. The current gold bull market will likely end closer to major debt defaults.
During the 1970s, the US and the world had a completely different debt profile than today. Debt levels were much lower than today, and GDP was growing faster than debt, as is evident in the following chart.
The risk of a sovereign debt default is clearly much higher today than during the 70s. Debt will continue to rise until confidence is completely lost. It is a debt trap—there is no way out.
So, although the current gold bull market is similar in structure to the 70s bull market, it is way more critical to seek safety in gold and related assets than it was during the 70s, since debt-based assets will be slaughtered. Failure to comply will likely lead to financial ruin.
Here is an updated version of my 70s gold bull market comparison:
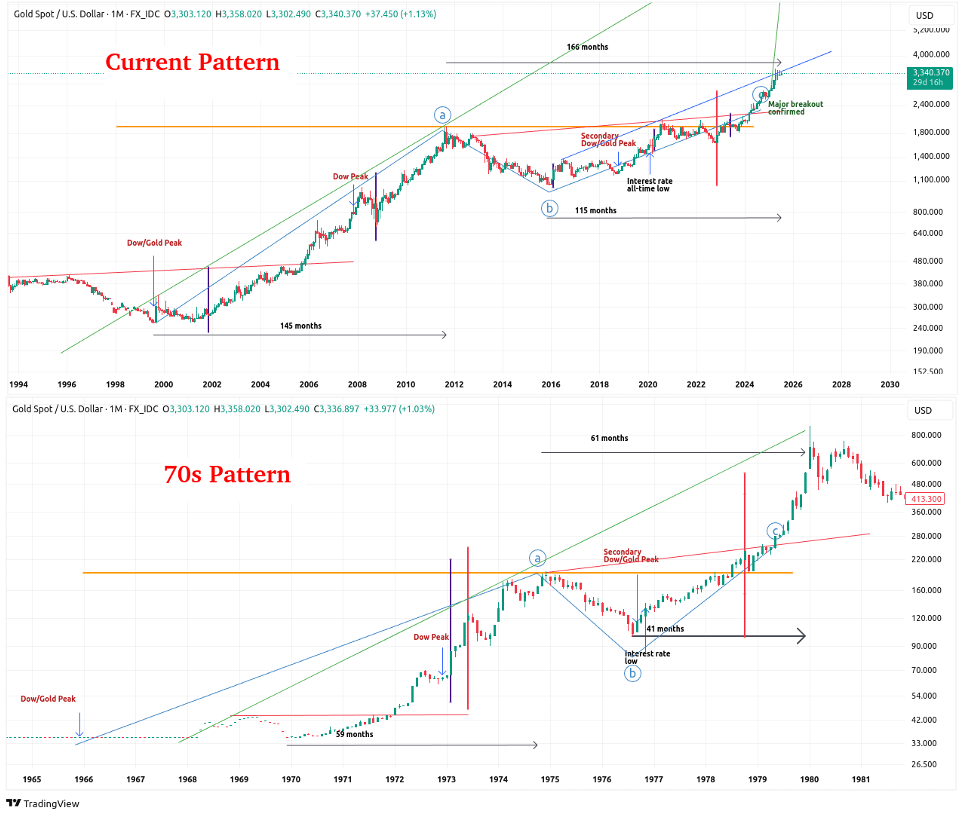 I have marked out two patterns (current and 70s patterns) that show how the recent breakout puts gold in the acceleration phase of the bull market.
Both patterns start at the Dow/Gold ratio peak (1966 and 1999, respectively). After the Dow/Gold ratio peaks, gold went on a strong bull run, which continued even after the 1973 and 2007 Dow peaks, respectively.
After the peaks at point a, the chart formed a cup-type pattern. During this consolidation (the cup), there was a secondary Dow/Gold peak, and also interest rates made an important low.
The structure of the 70s pattern was such that after the bottom (point b) during the cup phase, price moved relatively slowly up at first, but once it broke out at the red line, it moved up quite fast. Even current geopolitical risks (as they relate to the US dollar) continue to suggest that this is plausible.
The current pattern could be following that same type of progression. The move since the low of the cup phase (point b) has been slow, and now that the price has finally broken out at the red line, we are seeing an accelerated increase in price.
Get more of this kind of analysis at my premium gold and silver blog or my Silver Long-term Fractal Analysis Report.
Warm regards
Hubert Moolman
Read the full article here