

Donald Trump is again sowing chaos with respect to the trade war he has initiated.
US trading partners were not looking forward to July 9, the end of Trump’s 90-day hiatus on so-called “reciprocal tariffs” he announced in April, which caused a broad sell-off in global stock markets and a spike in US Treasury yields.
But like most of Trump’s deadlines, it was a moving target.
He said his administration plans to start sending letters on July 7th, dictating new tariffs to countries that have not yet signed a trade deal with the United States. The deadline for the higher tariffs is August 1st.
So far, only two trade deals have been signed — with the UK in early June and with Vietnam on July 2 — although several others are under negotiation.
In April, Trump announced a 10% base tariff rate on most countries and additional duties ranging up to 50%, although he later delayed the effective date for all but 10% duties until July 9.
The new date of 1 August offers countries a further three-week reprieve.
He also threatened an extra 10% levy on the BRICS nations (Brazil, Russia, India, China, and South Africa) (The Guardian)
All three US stock indexes fell on tariff jitters, the 10-year Treasury rose by 0.05%, and gold was 0.03% higher at $3,333.30 an ounce on Monday.
Gold has gained 27% year-to-date, and its year-on-year advance is nearly 42%.
Central bank buying
The World Gold Council (WGC) says gold is attracting more attention from central banks than at any time in the last decade.
In its annual central bank gold survey, published in June, the WGC said 95% of respondents expect global gold reserves to increase over the next 12 months. 43% of central bank reserve managers said they plan to increase their gold holdings this year, compared to 29% in last year’s survey. (Kitco News)
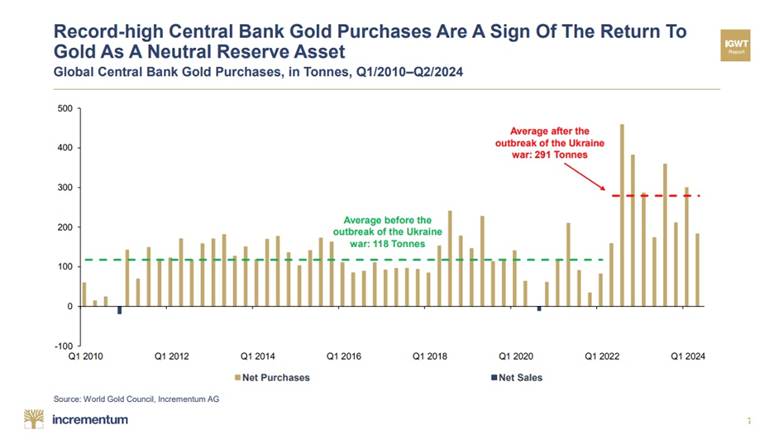
Over the past three years, central banks have purchased over 3,000 tonnes of the precious metal. Analysts predict they could add another 1,000 tonnes to their reserves this year.
Demand is largely being driven by emerging market central banks, which are diversifying their holdings away from the US dollar, more so than developed market central banks.
A more recent report from the WGC says gold purchases by central banks increased to 20 tonnes in May compared to 16 tonnes in April; the 12-month average is 27 tonnes.
“Fresh tensions in the Middle East may have reinforced the strategic appeal of gold for central banks looking to safeguard reserves against geopolitical shocks,” said Marissa Salim, senior research lead, APAC, via Hindu Business Line.
Poland is the largest bullion buyer in 2025, adding 67 tonnes to its reserves so far. The National Bank of Kazakhstan and the Central Bank of Turkey have each added 15 tonnes. Other important buyers in May were the People’s Bank of China and the Czech National Bank, which each bought 2 tonnes.
CNBC notes that gold, silver, and platinum have all posted big YTD returns as issues from market volatility to de-dollarization of central banks and the US deficit favor the metals market.
The publication says gold, silver, and platinum have all beaten traditional safe havens, the dollar and Treasuries, offering this explanation for why:
What’s taking place is a combination of the safe-haven trade occurring at the same time as concerns about the U.S. deficit and the de-dollarization wave among foreign central banks amid political shifts since President Trump’s election and a global realignment of interests.
Emerging global Tier 1 asset
A change to banking rules ostensibly to better insulate banks from economic crises could represent the next step in the process of de-dollarization, as the banking world moves in a direction that makes gold the center of a new monetary system.
Is Basel III setting up a new gold-backed monetary system? — Richard Mills
After the financial crisis, new banking rules known as Basel I, II, and III came into effect.
The regulations require banks to maintain proper leverage ratios and to meet certain minimal capital requirements. Tier 1 capital assets, such as cash and sovereign bonds (like US Treasuries), are considered the core measure of a bank’s financial strength from a regulator’s point of view.
Under the old Basel I and II rules, gold was rated a Tier 3 capital asset. Banks traditionally discounted a bank’s gold holdings by 50% of the market value. With gold’s value cut in half, banks had little incentive to hold gold as an asset.
As of April 1, 2019, gold bullion is a Tier 1 capital asset. Also, under Basel III, a bank’s Tier 1 capital assets must rise from the current 4% of total assets to 6%.
Because gold is now a Tier 1 capital asset, banks can operate with far less capital than when gold was classified as Tier 3. Then, banks had to hold extra capital on their books against gold holdings.
According to the World Gold Council, central banks bought gold in 2019 as a direct result of the reclassification of gold as a Tier 1 asset under Basel III.
Read more here
The implementation of Basel III across the global banking system has been ongoing since 2019, but the United States has not yet moved to it.
This, however, is changing. On July 1, 2025, the US was supposed to adopt gold as a Tier 1 asset under Basel III regulations, thus aligning US bank capital rules with global standards. The reforms will impact larger banks, those with $100 billion or more in assets, more significantly.
According to Stansberry Research,
Simply put, banks will no longer have to hold extra capital to support their gold holdings. And banks will be able to have gold on their books at 100% of the market value…
The Basel III regulation change will only increase the institutional demand for gold… which will continue to drive the gold bull market that’s underway.
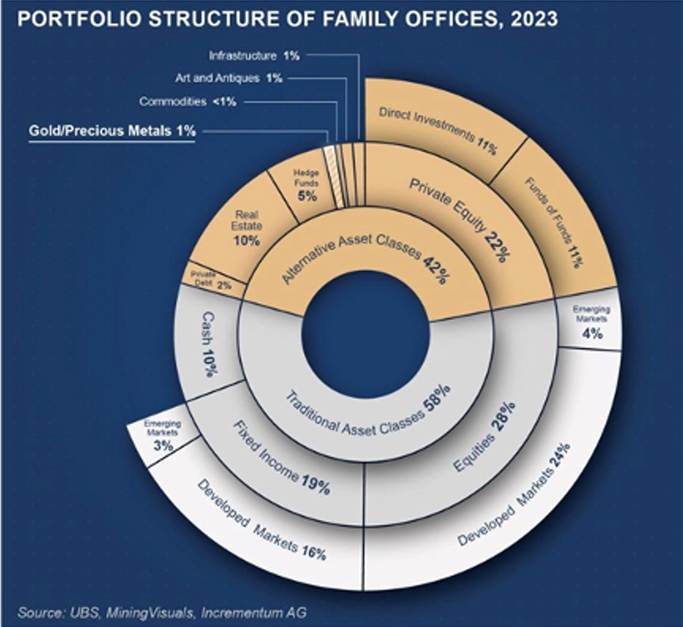
Gold has been less than a 1% allocation for most family offices and an even lesser allocation for all other investors for years and years.
But gold has outperformed the S&P (at even a total return basis) for TWENTY years and is the highest performing asset of 2025.
Far more importantly, gold’s real secular move has yet to even begin, despite over two (largely ignored) decades of outperforming traditional risk assets.
Ugly dollar, pretty gold
The decline in the value of the US dollar is, so far, one of the most newsworthy trends of 2025, along with the Trump tariffs.
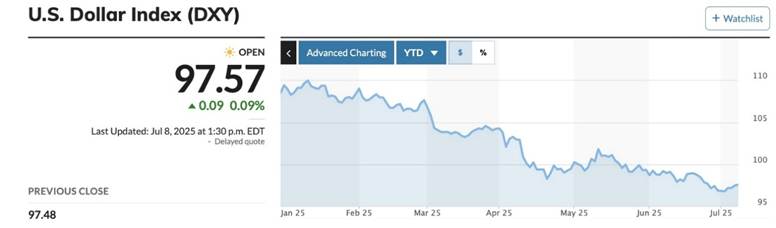
The US dollar index (DXY), which reflects the dollar’s value against a basket of other currencies, is down 11% year to date. According to CNBC, it was the worst first half of the year for the dollar since 1973.
June’s global fund manager survey from the Bank of America showed the net underweight position in the dollar is the largest in 20 years. Moreover, “short dollar” was among the top three “most crowded trades”, just behind “long gold” and “long Magnificent 7” stocks.
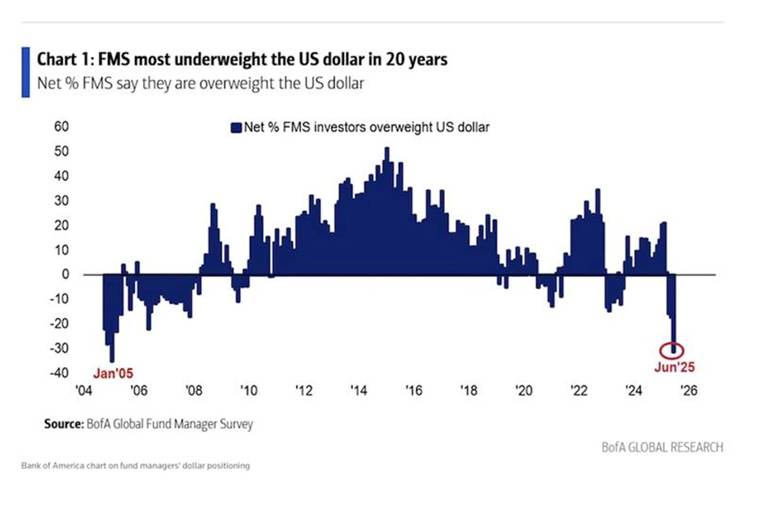
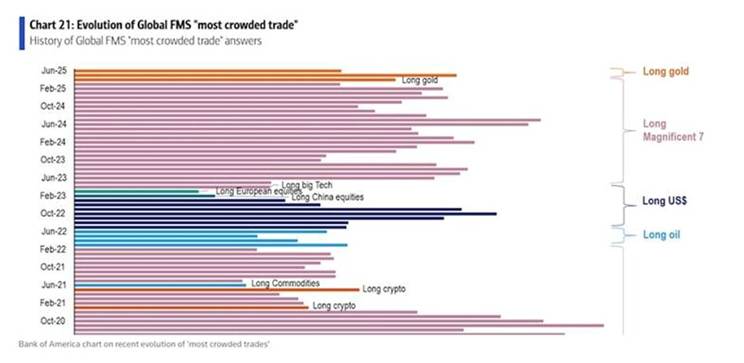
Reuters columnist Mike Dolan says the 20-year high in dollar underweighting by asset managers indicates both wariness of US assets at large — due to concerns about the current U.S. administration’s approach to global trade, geopolitics, and institutional integrity — and a more structural dollar retreat.
He quotes Vincent Mortier, chief investment officer at Amundi, saying, “The name of the game will be diversifying away from the U.S. and into European and emerging market bonds.”
Over at U.S. Global Investors, Frank Holmes notes that UBS says the dollar is now “unattractive”, with further declines expected as the US economy slows.
The de-dollarization trend continues, with foreign vendors from Latin America to Asia asking US importers to settle invoices in euros, pesos, and yuan to avoid USD currency swings.
Holmes observes the inverse relationship between gold and the dollar “has been on full display this year,” with gold in June trading at about $3,400, approximately $100 off its record-high set in early April. The precious metal has since slipped but is still at about $3,300/oz.
Holmes confirms what was said above about more emerging-economy central banks buying gold than developed-economy CBs, and he notes that many of these nations are exploring alternatives to the dollar-based financial system, which they increasingly see as a source of vulnerability rather than stability:
Consider Asia. CNBC reported how member countries in the Association of Southeast Asian Nations (ASEAN) are implementing a regional plan to reduce their dependence on the dollar by settling more trade in local currencies.
China is doubling down on its own payments network, the Cross-Border Interbank Payment System (CIPS), which offers a yuan-denominated alternative to SWIFT—the Society for Worldwide Interbank Financial Telecommunication, which facilitates international transactions between banks and institutions. [In June], China announced six new foreign banks as participants in the system, stretching its reach across Africa, the Middle East, and Central Asia.
Since Russia’s invasion of Ukraine in 2022, Western sanctions have highlighted the risks of holding too many dollar-based assets. According to the ECB, in five of the 10 largest annual increases in gold’s share of central bank reserves since 1999, the country in question had been sanctioned either that year or the one before.
For many emerging economies, gold serves as a form of geopolitical insurance. Treasury holdings and access to SWIFT can be frozen at any time. It’s more challenging to do the same with physical gold stored in a domestic vault.
Holmes concludes the dollar isn’t going anywhere anytime soon, but its supremacy is gradually slipping.
De-dollarization
More evidence of de-dollarization comes by way of recent shifts in so-called “cross-currency basis swaps.”
Analysts at banks including Morgan Stanley and Goldman Sachs noted that when markets melted down following Trump’s “Liberation Day” announcement of cross-the-board tariffs, the preference for dollars as measured by basis swaps was relatively minor and short-lived. Meanwhile, demand for other currencies such as the euro and yen has grown. (Yahoo Finance)
“Recent cross-currency basis movements suggest investors have less appetite to buy dollar-denominated assets and more appetite to buy those denominated in euro and yen,” the Morgan Stanley team, including Koichi Sugisak and Francesco Grech,i wrote in a June report. In fact, the US tariff impact appeared to be “triggering a temporary withdrawal from dollar assets,” the Morgan Stanley analysts wrote.
In a recent Project Syndicate column, author Desmond Lachman blames US dollar woes squarely on Trump, who, he says, “is further undercutting confidence in the dollar with his apparent lack of concern about keeping inflation in check.” Lachman notes inflation is currently running about the Fed’s 2% target and is at risk of rising further due to Trump’s aggressive tariffs on foreign imports.
Making matters worse, Trump has been casting doubt on America’s commitment to honoring its debt commitments fully. Buried in early drafts of his “Big, Beautiful Bill” was a provision allowing for the imposition of a “revenge tax” of up to 20% on foreign owners of US assets, including Treasury bonds, if they hail from countries with tax policies the Trump administration deems “unfair” to the US. Moreover, key Trump advisers have suggested forcing foreign central banks to convert the US Treasury bills they hold into 100-year US bonds without coupon payments, as part of the proposed Mar-a-Lago Accord.
Add to that Trump’s apparent disregard for the rule of law, and markets see little reason to trust the US.
The Congressional Budget Office has projected a federal budget deficit of $1.9 trillion this year, and federal debt rises to 118% of GDP in 2035, according to the CBO.
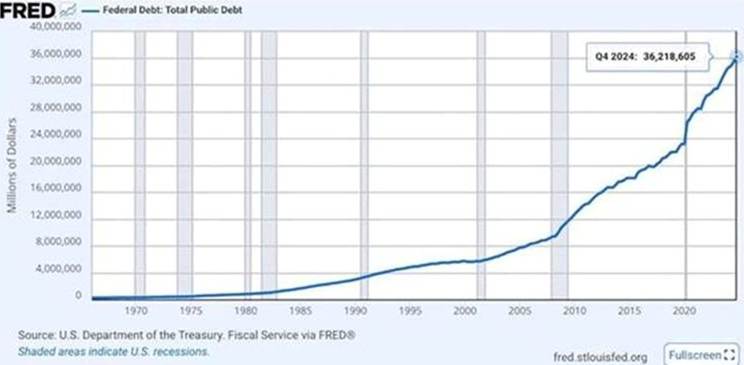
The national debt currently stands at $36.2 trillion.
BlackRock, the largest asset manager in the world, says the risk of a de-dollarization of the global economy has edged higher due to rising debt levels. Trump’s tax and spending bill alone will add $5 trillion to the national debt over the next five years.
Company analysts say that growing government debt is weakening demand for US assets like the dollar and long-dated US Treasuries like the 10-year and 30-year bonds. (The Daily Hodl)
BlackRock views debt as “the single greatest risk to the ‘special status’ of the US in financial markets.”
The firm’s investment managers warn that an increasing amount of government spending is being allocated to paying off interest on the debt — old news to us at A O T H.
Interest payments on the US debt topped $92 billion in May, surpassing every other federal expense except Medicare and Social Security.
Investors are starting to question whether long-term government bonds are still a safe haven, especially given the rising tide of US protectionism and the US retreat from its international commitments.
The US thinks the world needs them for trade when in reality, the world has other options. Canada’s bustling trade with China is one example. China’s trade with the US might be down 9% but with the rest of the world, it’s up over 6%.
A pullback in bond buying from central banks could send borrowing costs higher, putting the US government in a jam. Foreign buyers represent 30% of the $28.6 trillion US Treasury market. If they no longer see Treasuries as a safe haven, the Treasury would be forced to pay higher yields on bonds to attract buyers. That would put upward pressure on interest rates for mortgages, small-business loans, and other types of borrowing.
Japan, furious at the 25% tariffs slapped on it by Trump, is the largest foreign holder of U.S. government debt, $1.13 trillion in February. China, in a trade war with the US, is the second-largest foreign investor in Treasurys.
The Daily Hodl states:
According to the Committee for a Responsible Federal Budget (CRFB), the US is projected to spend 5.3% of its GDP – about 29% of all its revenue – on interest on the national debt by 2034.
BlackRock says there may not be enough natural demand to scoop up the amount of debt the US is trying to sell, which could prop up yields and make its debt burden even worse.
Money Control calls the US debt “a ticking global time bomb” in a recent article provocatively titled, ‘The empire is collapsing, reallocate before it’s too late.
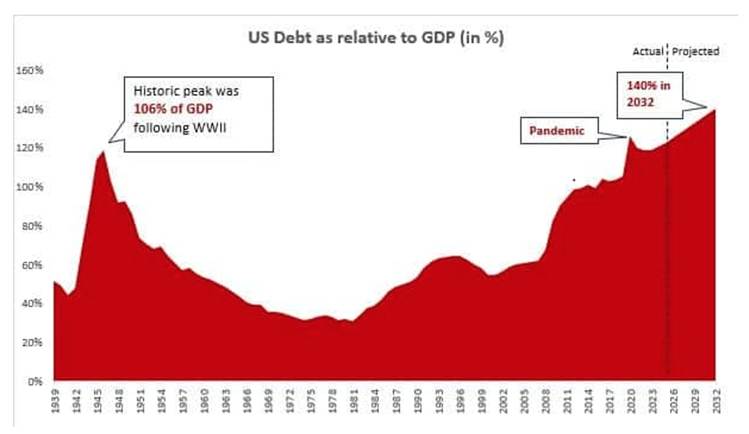
Americans’ $36T debt now represents 124% of GDP, a level unseen since the aftermath of World War II. By 2032, it will reach 140%.
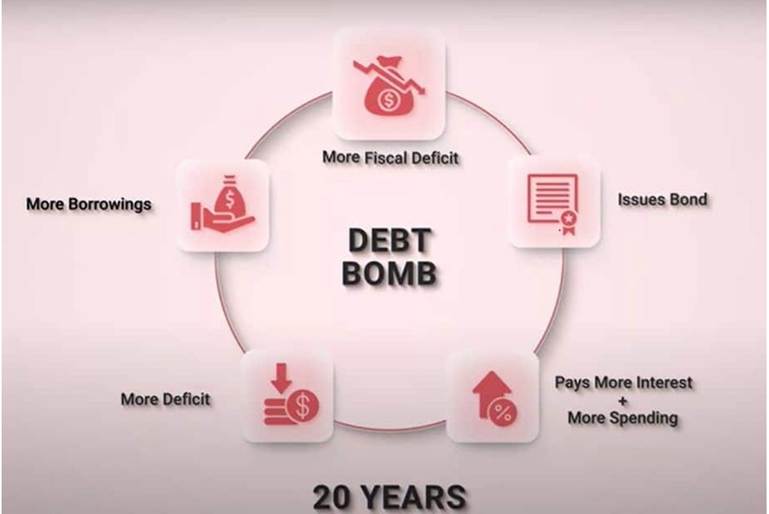
By now, we all know the facts: China and Japan are dumping US bonds, forcing America to borrow at higher rates, which leads to a vicious cycle of more debt and even higher interest payments.
Decades of unchecked spending, tax cuts, and populist politics have bloated the US balance sheet.
Money Control compares the current situation to 2008. Then, after markets fell off a cliff, they could be levitated artificially through quantitative easing. “But this time, that trick won’t fly. The US doesn’t have the room to print its way out anymore. The monster it fed has grown teeth.”
It urges investors to re-position by investing in gold and silver, rotating towards high-quality large-cap stocks, and cutting leverage.
Debt is a silent thief, stealing from the future to pay for the present. And the empire of debt is collapsing – not today, not tomorrow, but the fuse is definitely burning.
A CNBC video says the United States is about 20 years from defaulting on its debt. Quoting Kent Smetters, a University of Pennsylvania economics and public policy professor who led a team at the university’s Wharton School, “Fiscal policy is not sustainable. The economy essentially blows up. There is so much debt under current law that fixed income markets, bond markets will collapse.”
Bridgewater Associates founder Ray Dalio says there is more than a 50% chance of the United States facing a crisis within three years if the US doesn’t adequately address the problem. The macro investor has studied how countries go broke — there are cycles that have led to big bubbles and busts — and he is deeply concerned about what he sees. “The supply that’s going to be produced by deficits is greater than the demand for that debt, like watching somebody having a circulatory condition.”
War, tariffs, and the coming recession
Thinking more short-term, economist Stephen Roach, a regular contributor to Project Syndicate, believes war in the Middle East and the Trump tariffs “have the potential to feed on each other, threatening a vulnerable world economy that is already at risk of stalling out. This year’s twin shocks make a recession more likely.”
In a June column, Roach proposes his theory of capital risk, which is that it doesn’t take much to tip an economy that is stalling into outright recession. “This simple rule has worked remarkably well in predicting global recessions over the past 45 years,” he writes.
Roach says a worldwide recession is usually associated with global GDP slowing to +2-2.5%. Over the past 45 years, the global economy’s stall speed has been in the 2.5-3% range. When it’s in this zone, the world lacks the resilience to withstand a shock. This is what happened in the last four global recessions.
According to the IMF’s latest World Economic Outlook, global GDP is expected to slow to 2.5% in 2025 — smack dab in the middle of the stall-speed zone, 2% to 3%.
Roach assumes that the Trump tariff package that eventually emerges will be something close to a 10% global tariff — which I agree with — not the tariff but the assumption. While this is lower than Trump’s “reciprocal tariffs” announced in April, it is still about five times greater than the 1.9% average tariff rate going back 30 years before his April 2 “Liberation Day” announcement.
An interesting aside: While exempt from reciprocal tariffs, the Trump administration slapped 25% tariffs on Canadian exports that don’t comply with the CUSMA trade agreement, along with tariffs on steel, aluminum, and automobiles. US and Canadian negotiators are working towards a bilateral trade deal by July 21.
The Globe and Mail reported that if it wasn’t for imports and exports of gold, silver, and platinum — all of which have soared in price year to date — Canada would have a trade deficit of $10.3 billion. As it stands, by including trade in these metals, Canada’s trade deficit with the world fell to CAD$5.9 billion in May compared to a record-high $7.6B in April.
A 10% tariff, Roach writes, is a “shock by any standards”, creating downside risks for the still export-dependent Chinese economy and uncertainty for the US economy that will lead to pullbacks in capital spending and hiring.
With the US and Chinese economies collectively accounting for a little more than 40% of cumulative global GDP growth since 2010, one should not underestimate a tariff war’s potential damage to the world economy.
As for war in the Middle East, there have been missile strikes by Israel and Iran, “bunker bombs” dropped on suspected uranium enrichment facilities by US bombers, and an Iranian attack on a US base in Qatar.
Roach notes that the macroeconomic impact of wars is typically measured through oil prices. If hostilities continue, “there will be significant upside risks to energy and other commodity prices as markets start to worry about Iran’s options for retaliation, which could include disruption of oil production and distribution, as well as of shipping lanes.”
Heightened geopolitical tensions have prompted the US Energy Information Administration (EIA) to revise upward its crude oil price forecasts for the second half of 2025, according to the agency’s latest outlook. (Trend News Agency)
Another gold-positive factor is a potential decrease in interest rates. As of July 6, the CME Fed Watch tool is pricing in a 91.5% probability of a September rate cut, and markets are pricing in 65 basis points of easing by year-end.
FX Empire reports that Goldman Sachs has revised its Fed outlook, now expecting three interest rate cuts instead of one, due to tariff impacts and labor market softening.
Lower rate expectations reduce the opportunity cost of holding gold, creating favorable positioning for traders anticipating further policy easing. President Trump added fuel by demanding lower rates, stating he would not appoint a Fed chair opposed to cuts and signaling rates should drop toward 1%.
Trump has since said he’s considering accelerating when he will announce his pick to succeed Fed Chair Jerome Powell whose term runs out in 11 months. The successor will 100% cater to Trump’s demand for lower interest rates.
Gold is de facto money.
Consider the June finding by Myrmikan Research that markets, far from crashing sometime in the near future, have already crashed. How could this be? Well, from the beginning of 2025 to the market bottom on April 8, the S&P 500 fell 15%, and the gold price rose 17%.
In real (after-inflation) terms, however, the S&P crashed 26.4%.
The May bounce in the stock market, which is now flat year-to-date in nominal terms, is mostly erased in real terms: the S&P 500 remains down 21.5% for the year in terms of gold.
Dow to gold ratio
The Dow to gold ratio measures how many ounces of gold it would take to “buy the Dow”. The Dow Jones Industrial Average is a price-weighted index of 30 large corporations that represent the different sectors of the US economy, such as financial services, manufacturing, and IT.
The Dow to gold ratio expresses the DJIA as a multiple of the price of one ounce of gold. So, for example, if the Dow is worth 35,000 points and the gold price is $1,750/oz, the Dow to gold ratio is 20. As Zacks reports, the ratio has fluctuated widely over history, trading as low as 1.0 during the stock market crash of 1980 to above 40 during the dot-com bubble of 2000.
For investors, the ratio is valuable because it tracks how gold has performed relative to corporate America. It can also be used to determine whether the stock market is undervalued or overvalued.
The Dow is currently trading at 44,240, and the gold price is $3,330, so the Dow to gold ratio is 13.5. The lower the ratio goes, the worse it is for stocks, and the better it is for gold.
Below are two charts: a 20-year Dow to gold ratio and a 20-year gold chart. The chart is interactive if you click on the link.
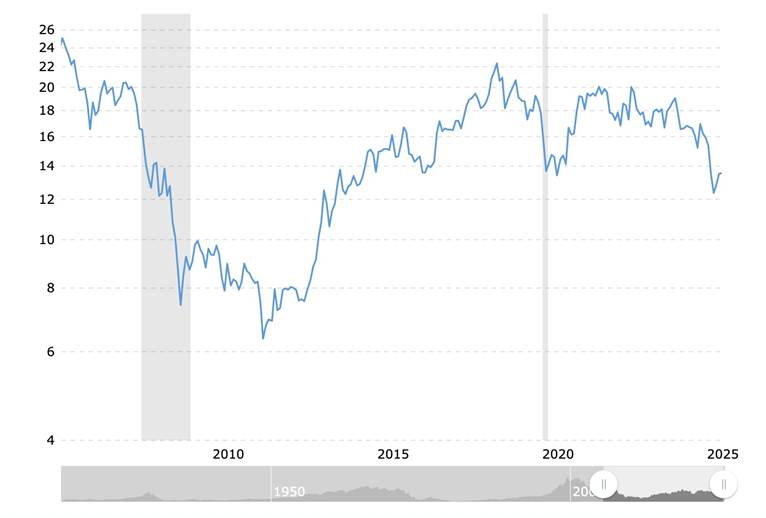
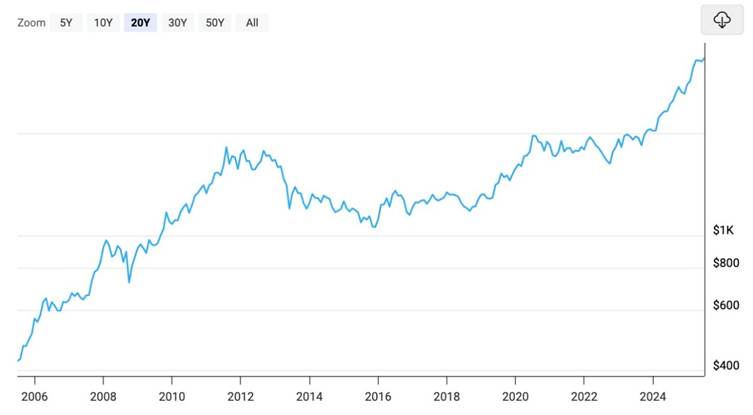
At AOTH, we believe a stock market crash is coming, maybe not tomorrow, maybe not next month, but like winter in the north country its coming. Could the ratio go as low as the 20-year nadir of 6, in August 2011? That would represent a significant Dow crash that would be gold positive.
Precious metals offer protection against looming economic challenges — Richard Mills
The chart below by Sunshine Profits shows the gold price climbing during the stagflationary 1970s, surging from $100 per ounce in 1976 to around $650 in 1980, when CPI inflation topped out at 14%.
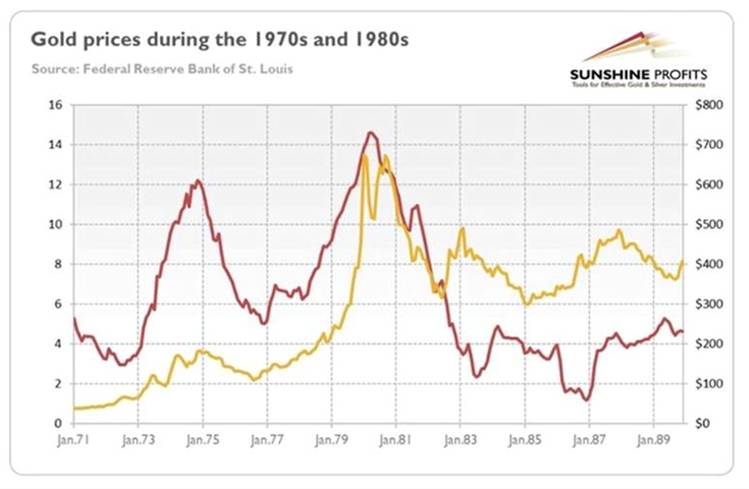
Source: Sunshine Profits
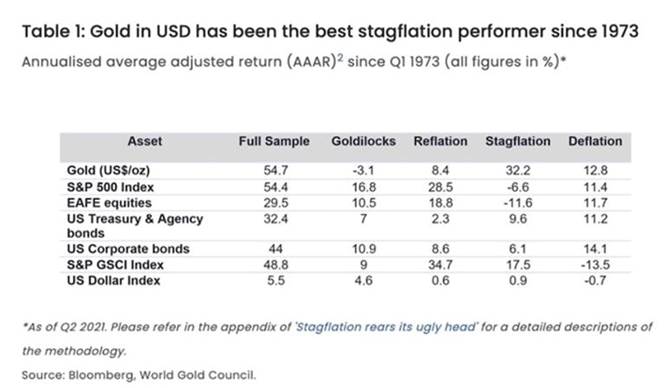
In fact, gold outperforms other asset classes during times of economic stagnation and higher prices. The table below shows that, of the four business cycle phases since 1973, stagflation is the most supportive of gold, and the worst for stocks, whose investors get squeezed by rising costs and falling revenues. Gold returned 32.2% during stagflation compared to 9.6% for US Treasury bonds and -11.6% for equities.
A 2023 Forbes article asks ‘How Does Gold Perform With Inflation, Stagflation And Recession?
How’s this for performance? In six of the last eight recessions, gold outperformed the S&P 500 by 37% on average.
Gold stocks
Myrmikam Research notes that gold is still cheap. At $3,300 per ounce, gold comprises just 13% of the Fed’s assets, the same level as in 1971. The market demands one-third backing in normal times. These are not normal times, and the Fed’s other assets (like the $) are not sound.
The gold miners are cheaper still. According to Myrmikan,
As yet, we have only two of the three conditions necessary for a mania: a rising nominal gold price and a rising real gold price. If the Fed panics and increases dollar liquidity, we should see at least a redux of 2016 and 2020 gold mining stock returns; now that nominal prices are starting to reveal real values, and the ongoing devaluation of the dollar is obvious to everyone, the performance will likely be better.
Gold stocks analyst Adam Hamilton noted on June 27 that with the second quarter all but wrapped up,
The gold miners continue to stack records, on the verge of reporting their best quarterly results ever. And remarkably, Q2’25 will prove the fifth quarter in a row they’ve accomplished that. These high prevailing gold prices are fueling epic windfall profits for gold miners, driving fantastic fundamentals. Investors are starting to recognize those, with gold stocks really outperforming their metal in its recent high consolidation.
Hamilton is talking here about gold producers. Every quarter, he analyzes the latest results reported by the 25 largest gold miners of the gold-stock ETF, GDX. Estimating a Q2 all-in-sustaining cost (AISC) of $1,375/oz, Hamilton says:
This quarter’s $3,284 average gold price less $1,375 GDX-top-25 average AISCs, would yield super-rich earnings of $1,909 per ounce! That would prove the highest ever by far for the major gold miners, utterly shattering Q1’25’s previous record of $1,470. And that would soar 74% YoY from Q2’24’s $1,099. This would be spectacular even if it were a one-off windfall quarter, but it’s the latest in a long line of great ones.
Over the last seven reported quarters starting in Q3’23, the GDX top 25’s implied unit earnings rocketed up 87%, 47%, 31%, 84%, 74%, 78%, and 90% YoY! Q2’25’s probable 74% merely adds on to that truly extraordinary streak. No other sector in all the stock markets has enjoyed such colossal profit growth. Yet because gold stocks are a small contrarian sector, they’re largely overlooked by the great majority of investors.
Many are now trading at teens or even single-digit trailing-twelve-month price-to-earnings ratios! That’s already dirt-cheap even before those spectacular Q2 results are factored in.
Hamilton believes gold producers, despite throwing off record cash due to high metal prices, are undervalued and have a long way to move up:
While retail investors are apathetic without gold surging, professional investors have been increasingly buying gold stocks. That has driven outsized GDX gains during gold’s recent high consolidation, which is quite unusual. The potent combination of gold likely resuming grinding higher in its autumn rally and gold miners’ epic record Q2 results ought to accelerate gold-stocks gains. They still have big catch-up rally to do.
Conclusion
A CNBC video has Ray Dalio saying there is more than a 50% chance of the United States facing a crisis within three years if the US doesn’t adequately address the problem.
Despite frothy stock markets, the risk of the US falling into a recession is real. Renowned economist Stephen Roach believes war in the Middle East and the Trump tariffs “have the potential to feed on each other, threatening a vulnerable world economy that is already at risk of stalling out. This year’s twin shocks make a recession more likely.”
According to Economic LongWave, a succession of asset bubbles
aligns perfectly with Nikolai Kondratieff’s long-wave theory, which predicted economic cycles lasting 40-60 years:
According to this framework, we remain in the centralized fourth wave that began around 1950, and we’re approaching the “winter” phase — a period of economic contraction, debt deflation, and structural reform typically lasting 10-15 years.
Commentator John Whitehead believes America’s military misadventures are more about maintaining a failing empire than national defense.
“It’s about preserving a military-industrial complex that profits from endless war, global policing, and foreign occupations—while the nation’s infrastructure rots and its people are neglected,” he writes.
At AOTH, we believe a stock market crash is coming. The Dow to gold ratio is currently at 13.5, meaning it takes 13 and a half ounces of gold to buy the Dow stock market index.
Could the Dow-to-gold ratio go as low as the 20-year nadir of 6.36 in August 2011? That would represent a significant Dow crash that would likely be gold positive.
Gold producers are on the verge of reporting their best quarterly results ever, buoyed by high gold prices. Yet gold stocks have largely been overlooked by the majority of investors, and many continue to be undervalued on a per-share basis.
Gold producers are the first group to move in a gold bull market, and some already have, enjoying strong YTD gains. The mid-tier producers are next, and last come the gold juniors.
The junior resource market has been starved for capital over the last two to three years, and most gold juniors, abandoned by investors, are obscenely cheap. But the tide is turning, and many small-cap miners are getting the money they need for drill programs that could move their needles significantly.
Another surge in the gold price, especially in the event of a stock market crash, would help to attract more retail buying and bring gold junior stock prices more in line with their ounces in the ground.
If all of the above isn’t enough to bring you into gold’s camp, consider this fun fact and chart, courtesy of John Rubino’s Substack:
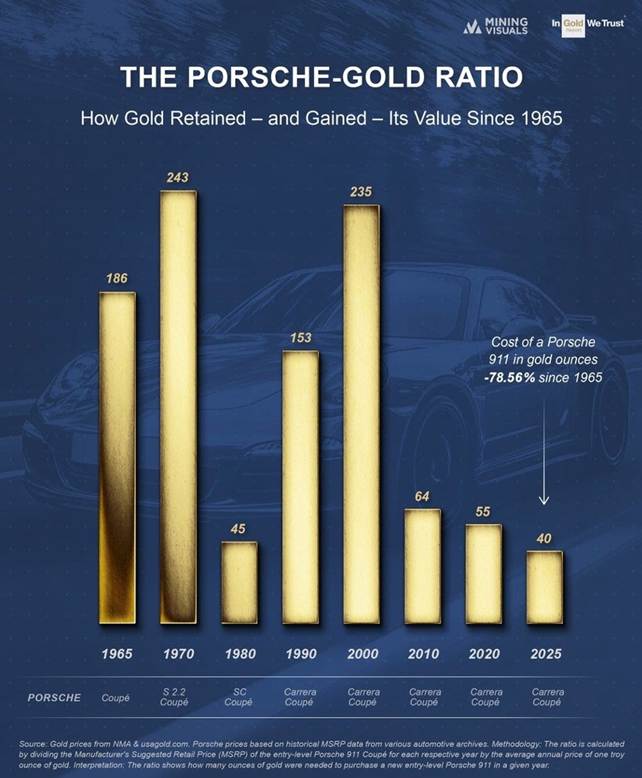
The Porsche 911 sports car has seen massive deflation so far in this century when priced in gold, as the metal has risen faster than the car’s sticker price. Whereas a 1965 Porsche Coupe cost 186 ounces of gold to buy, a 2025 Porsche 911 only costs 40 ounces — a decline in gold ounces of 78.56%.
Plus, this old chestnut: Since the US dollar was taken off the gold standard in 1971, the USD has lost 99% of its purchasing power. Gold, meanwhile, has risen from $41 an ounce in August 1971 to its current $3,294, a gain of 8,034%.
Conclusion
Growing government debt is weakening demand for US assets like the dollar and long-dated US Treasuries like the 10-year and 30-year bonds.
An increasing amount of government spending is being allocated to paying interest on the debt.
China and Japan are dumping US bonds, forcing America to borrow at higher rates, which leads to a vicious cycle of more debt and even higher interest payments.
There are plenty of reasons to be bullish on gold, the most obvious being it is “the last safe haven standing” after investors have cooled on the dollar and US Treasuries, mostly due to the economic chaos being created by the Trump administration.
Let’s remember Elon Musk’s post on X: “If [the Trump administration’s mismanagement of the economy] continues, America goes de facto bankrupt, and all tax revenue will go to paying interest on the national debt with nothing left for anything else.”
In May alone, the government collected $371 billion in revenue, but spent $687 billion, leaving a deficit of $316 billion.
The annual deficit is already $1.365 trillion, 14% higher than last year.
The national debt stands at $36.2 trillion and will grow up to $5T more with Trump’s so-called Big Beautiful Bill, which has been passed.
Interest payments on the US debt topped $92 billion in May, surpassing every other federal expense except Medicare and Social Security.
Investors are questioning whether long-term government bonds are still a safe haven, especially given the rising tide of US protectionism and the US retreat from its international commitments.
Central banks continue to stock up on gold bullion. Emerging-market countries saw how $300 billion of Russia’s foreign exchange reserves (mainly dollars, euros, and British pounds) were frozen by the United States and its allies following the invasion of Ukraine. They didn’t want it to happen to them, hence the decision to buy gold.
Over the past three years, central banks have purchased over 3,000 tonnes of the precious metal. Analysts predict they could add another 1,000 tonnes to their reserves this year.
Another reason for central banks to buy gold is the change to Basel III banking regulations.
Under the old Basel I and II rules, gold was rated a Tier 3 capital asset. Banks traditionally discounted a bank’s gold holdings by 50% of the market value. With gold’s value cut in half, banks had little incentive to hold gold as an asset.
As of April 1, 2019, gold bullion is a Tier 1 capital asset. Also, under Basel III, a bank’s Tier 1 capital assets must rise from the current 4% of total assets to 6%.
Central banks bought gold in 2019 as a direct result of the reclassification of gold as a Tier 1 asset under Basel III.
According to gold market commentator Matthew Piepenburg, the Eurozone doesn’t have the gold (nor the cash) promised to their counterparties. In a world losing confidence in debased fiat money, and countries drowning in global debt totalling $300 trillion, gold is becoming THE Tier 1 asset.
Gold and the US dollar typically move in opposite directions. The US dollar index is down 11% year to date, and it was the worst first half of the year for the buck since 1973. Meanwhile, gold is up 27% YTD.
UBS says the dollar is now “unattractive”, with further declines expected as the US economy slows.
The de-dollarization trend continues, with foreign vendors from Latin America to Asia asking US importers to settle invoices in euros, pesos, and yuan to avoid USD currency swings.
Read the full article here