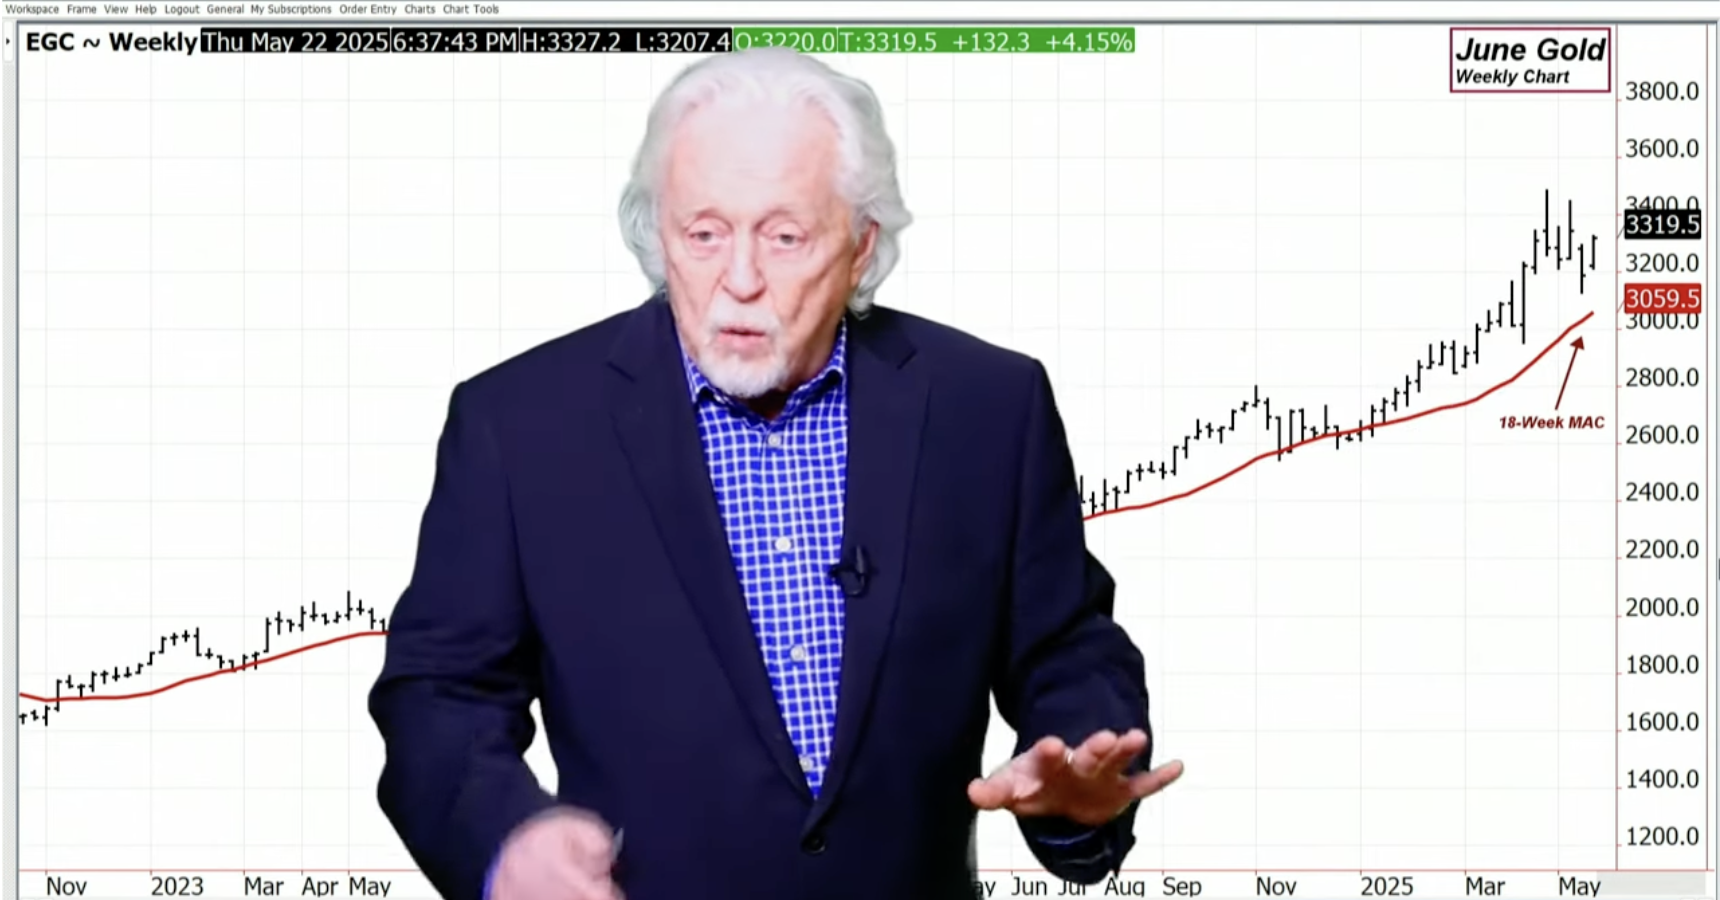
When I look at the gold market, you can see that on a weekly chart, it’s staying over the 18-week moving average of closes, so the bias stays up in the market. When you come to the daily chart, you can see how it fell. It came up now, the question is it slip back here or is the market able to build on that?
For the moment when you put on the swing line, it looks not better than it does just looking at a chart without it because you have higher lows and higher highs – that’s bullish. The 18-day average of closes is where I expect the battleground [to be]…
When you throw on Bollinger Bands, you get a target that could be $3409 if the market were to take off to the upside in some event.
Read the full article here


Leave a Reply