

With Gold’s weekly parabolic trend still Short — uncannily so given there’s not been a wit of substantive price decline throughout — we open with British band Ace from back in ’75: ![]() “How lonnng… has this been goin’ onnn…”, such pop hit reaching Billboard’s Hot 100 No. 3 slot on Saturday, 05 April of that year, with Gold having settled the day before at 174.
“How lonnng… has this been goin’ onnn…”, such pop hit reaching Billboard’s Hot 100 No. 3 slot on Saturday, 05 April of that year, with Gold having settled the day before at 174.
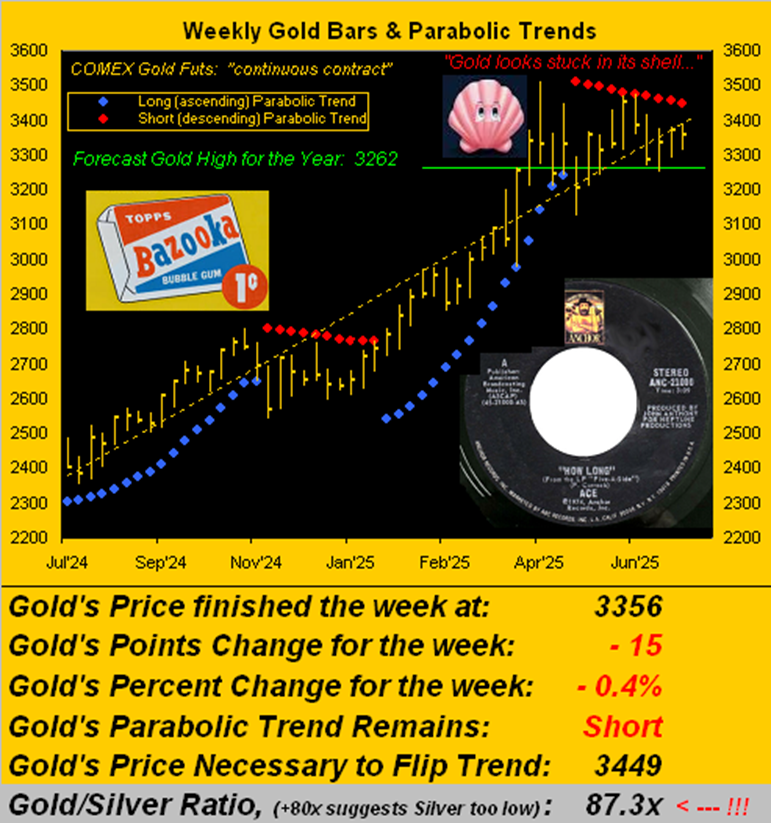
Fast forward to Gold having settled yesterday (Friday) at 3356 and ’tis a 50-year price increase of +1,829% … just in case you’re scoring at home.
‘Course, compared to the 1¢ cost in 1975 for one piece of Bazooka Bubble Gum, such piece today is bulk-marketed for 24¢, an increase of +2,300%: thus Gold is lagging bubble gum inflation.
“And mmb, by the money supply, it’s about that too, eh?”
Similarly so, Squire. The StateSide “M2” money supply for April 1975 was $935B. From then to today at $22T, ’tis +2,253%. So by either measure, “Got Gold?”
But as to our query via Ace for the duration of Gold’s current weekly parabolic Short trend, note a 10th rightmost red dot having now appeared on the weekly bars from a year ago-to-date. Indeed, Gold appears ever so stuck it its shell of late:
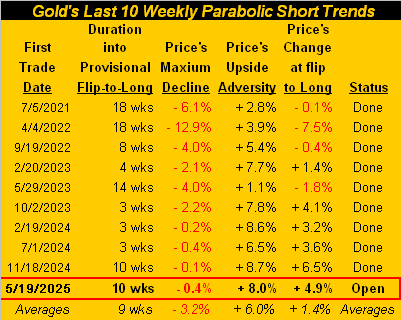
Moreover as you regular readers well know, a favourite quip of ours is “Shorting Gold is a bad idea”. To wit, we’ve the following table of Gold’s last 10 (inclusive) weekly parabolic Short trends, the current stint as bordered in red. In assessing the average price extremes at the table’s foot, price’s maximum decline — for which the silly Shorts seek — is basically half (-3.2%) that of the adversity suffered (+6.0%) during the course of the trade. To be sure, success depends upon determining if decline precedes upside adversity or vice-versa, and at what point profit — if any — is realized. And as the bordered box shows, this ongoing Short trend has recorded at most just a -0.4% decline versus +8.0% of a “pain in the Shorts” if you will:
Albeit to be fair, such Short stints recorded from 2012 through 2015 instead squashed the Longs. Markedly, from Gold’s high at 1923 on 06 September 2011 to the low at 1045 on 03 December 2015 was a -45.7% stunner. Since then however, monetary debasement has been mostly moon-bound per our opening Gold Scoreboard’s right panel.
As to “The Now”, regardless of Gold being shell-stuck in this continuing Short trend to nowhere, 10 weeks in duration is getting (dare we say) “Long” in the tooth. Price’s expected weekly trading range is now 139 points (the daily currently 46 points). So with present price (3356) now -93 points below the Short-to-Long price (3449), an ensuing firm week for Gold can flip the trend en route toward another All-Time High, (which presently remains 3510 from back on 22 April). “Get Gold!”
Next let’s shift gears to the second half of this missive’s title with respect to the pending S&P’s sell, which upon kicking in ought ring out many a Gold bell. To peruse the FinMedia, in Stocks-Land all is well. With pursuance of math a thing of the past, each outlet parroting what each other is reporting in turn portrays such happy stocks days. Now let’s go to The Truth.
First, fundamentally:
-
From CNBC[S] on Thursday: “…Quarterly [Q2] earnings reports this week have exceeded Wall Street’s expectations, fueling investor confidence…” the S&P in turn having recorded another all-time intra-day high yesterday at 6315, seriously?
-
Bloomy (yesterday): “…markets are behaving rationally…” The trailing 12-months price/earnings ratio of 46.9x is rational?
-
Morningstar yesterday: “…New research finds that valuation expansion — not stronger fundamentals — has fueled US stocks’ dominance since 2008…” They’re just figuring this out now?
Let’s be specific about the young Q2 Earnings season to this point: for the 503 constituents that comprise the S&P 500, we count 40 having thus far reported. Oh to be sure, 83% of those have beaten estimates! Ain’t that great?
But wait: Only 65% actually made more money than in Q2 a year ago. Uh-oh. Say it ain’t so: “Well that wasn’t on the TV, Emeline!”
Nor shall it be as ’tis beyond the paygrade of the participants engaged in The Investing Age Of Stoopid to calculate. And to fairly acknowledge whilst ’tis still very early in Q2 Earnings Season, that 65% bottom line improvement thus far is less than the 66% for Q1, let alone the 69% for Q4. Which for you WestPalmBeachers down there means the pace of year-over-year quarterly earnings improvement is weakening. Whoopsie!
Second, technically:
The S&P 500 is now “textbook overbought” through the last 18 trading days. Hardly is that a record, but ’tis what ’tis.
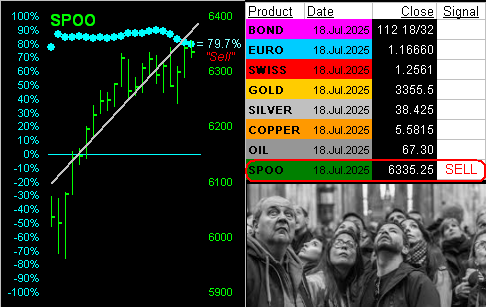
Further, let’s go inside the deMeadville proprietary numbers per the following display relating directly to the S&P 500 futures (aka the “Spoo”). Per the below graphic, the left-hand panel is the Spoo’s daily bars for the past 21 trading days (one month). So in sync with conventional wisdom, obviously, the market never goes down.
However, the leading “Baby Blues” — those dots of trend consistency — have just settled below their key +80% axis as labeled at 79.7%. From a year ago-to-date, such phenomenon has occurred but five other times leading to an average price drop within the ensuing 21 trading days of -172 points. To be sure from here, ‘twould be less than a -3% correction, albeit the worst of the five prior cases would be basically be more than -7% down. Such magnitude is not (yet) a prediction; rather ’tis smart of which to be wary. The “SELL” in the table of the BEGOS Markets nightly readings of the “Baby Blues” is our alert to this condition, for which attention ought be paid:
“But wait a sec, mmb, ’cause the economy’s suddenly roaring! So much higher still for stocks, right?”
Not necessarily, dear Squire. A “roaring” (as you put it) economy means the Federal Open Market Committee shan’t vote to cut the FedFunds rate come 30 July, (eight trading days from today). And disheartened cut expectations do not play well into equities.
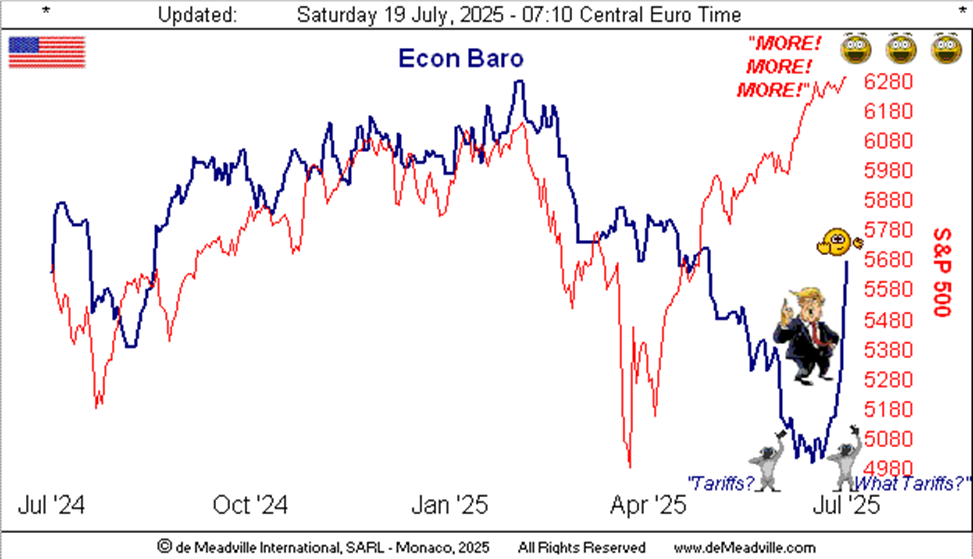
Still to Squire’s point, since 09 July the Economic Barometer has posted a shocking recovery: ‘tis the largest 8-trading-day bounce for the Baro in its 27-year history! Indeed for the 18 incoming metrics of just this past week, 14 improved period-over-period. Standouts included June’s Industrial Production/Capacity Utilization, Core Retail Sales, and Housing Starts/Permits: all improved, all beat consensii, and all had their May readings revised higher.
As to inflation, there was quite a dichotomy between that for retail versus wholesale. June’s Consumer Price Index pace leapt from +0.1% in May to +0.3%, yet the month’s Producer Price Index recorded no increase whatsoever. Does that mean July shall be kinder to the consumer? But then, there are more tariffs-a-brewin’! Either way, for the recent Baro, ’tis been “Up, Up and Away, Olé!”
Not to place a damper on all the equities’ and economics’ euphoria, we’ve nonetheless this from the “Feet on the Ground Reminders Dept.” As noted, the FOMC releases its next Policy Statement on 30 July. And preceding it that same morning comes the first peek at Q2’s Gross Domestic Product. Per the Baro, we anticipate it shan’t be pretty. Yet now suddenly, the economy (per Squire) is “roaring”, right? Write it down, (double entendre).
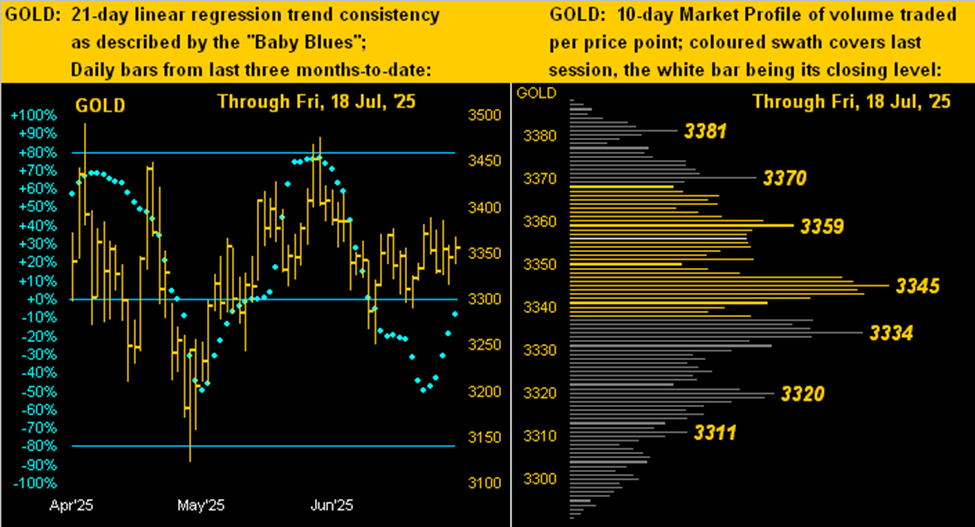
Meanwhile back to Gold we go with our two-panel graphic of the daily bars from three months ago-to-date on the left and on the right the 10-day Market Profile. Because the “Baby Blues” again denoting trend consistency are essentially at 0%, it means that Gold of late is, well, trendless. Nearby volume-dominant support and resistance are as labeled in the Profile:
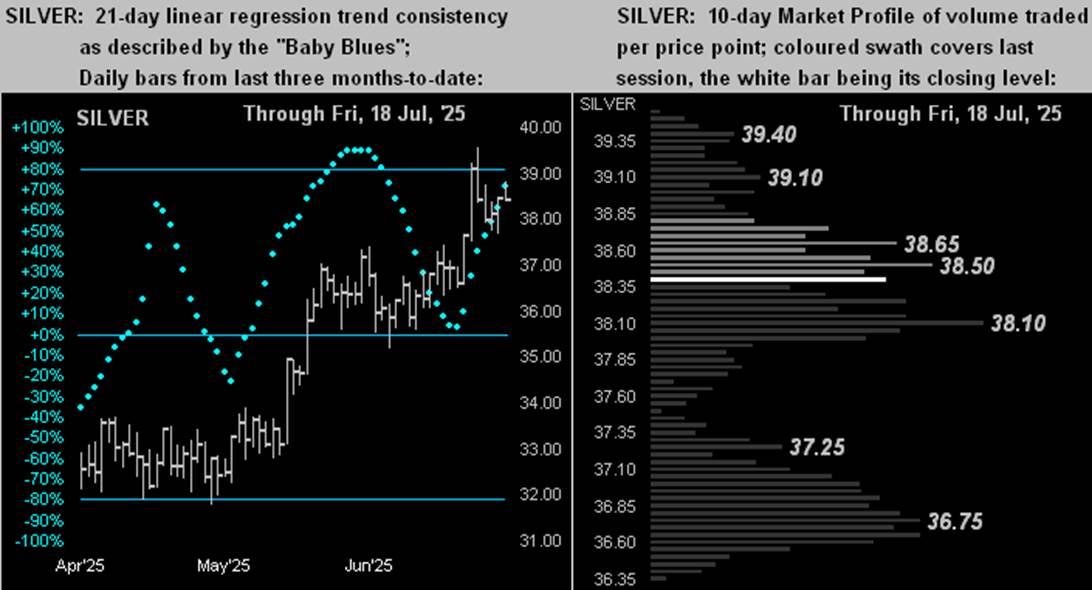
Silver however, on the heels on the prior week’s upside drama, fares better than Gold in the overall picture. The climbing out of her “Baby Blues” (at left) are uptrend supportive, whereas in her Profile (at right) presently priced at 38.43 is just above the most volume-dominant supporter of 38.10. Hang in there, Sister Silver!
So with Gold still stuck in its shell but the S&P poised for a sell, let’s look at the Stack, for ’tis just swell:
The Gold Stack
Gold’s Value per Dollar Debasement, (from our opening “Scoreboard”): 3853
Gold’s All-Time Intra-Day High: 3510 (22 April 2025)
2025’s High: 3510 (22 April 2025)
Gold’s All-Time Closing High: 3453 (13 June 2025)
The Weekly Parabolic Price to flip Long: 3449
10-Session directional range: up to to 3389 (from 3291) = +98 points or +3.0%
Trading Resistance: by the Profile 3359 / 3370 / 3381
Gold Currently: 3356, (expected daily trading range [“EDTR”]: 46 points)
Trading Support: by the Profile 3345 / 3334 / 3320 / 3311
10-Session “volume-weighted” average price magnet: 3342
The 300-Day Moving Average: 2798 and rising
2025’s Low: 2625 (06 January)
The 2000’s Triple-Top: 2089 (07 Aug ’20); 2079 (08 Mar’22); 2085 (04 May ’23)
The Gateway to 2000: 1900+
The Final Frontier: 1800-1900
The Northern Front: 1800-1750
On Maneuvers: 1750-1579
The Floor: 1579-1466
Le Sous-sol: Sub-1466
The Support Shelf: 1454-1434
Base Camp: 1377
The 1360s Double-Top: 1369 in Apr ’18 preceded by 1362 in Sep ’17
Neverland: The Whiny 1290s
The Box: 1280-1240
Into the new week can the Econ Baro seek a further peak? Probably not, although neither should it succumb much, if at all: just five metrics come due, Monday most notably bringing for June the Conference Board’s lagging indicator known as “Leading Indicators”. Expectations are for the reading to remain negative as ’twas for May: no argument here.
As for our anticipated S&P 500 correction, here are a few P/E nuggets to bear in mind:
-
The day before the Garzarelli Crash of ’87 the P/E was 20.3x;
-
The day before commencement of the DotComBomb of ’00-’02 the P/E was 29.3x;
-
The day before the start of the FinCrisis of ’07-’09, the P/E was 18.7x.
As aforementioned, ’tis now 46.9x, the S&P yielding less than one-third that of the “riskless” U.S. T-Bill.
Note: math-challenged “AI” (“Assembled Inaccuracy”) puts the S&P’s P/E at 25.9x … wrong. (Just wait until “AI” gets its hands on your discretionary portfolio. Reprise: Whoopsie!)
So to wrap:
Query One: “Do you know where your stocks’ stops are?”
Query Two (again): “Got Gold?“
Cheers!
…m…
www.TheGoldUpdate.com
www.deMeadville.com
and now on “X”: @deMeadvillePro
Read the full article here