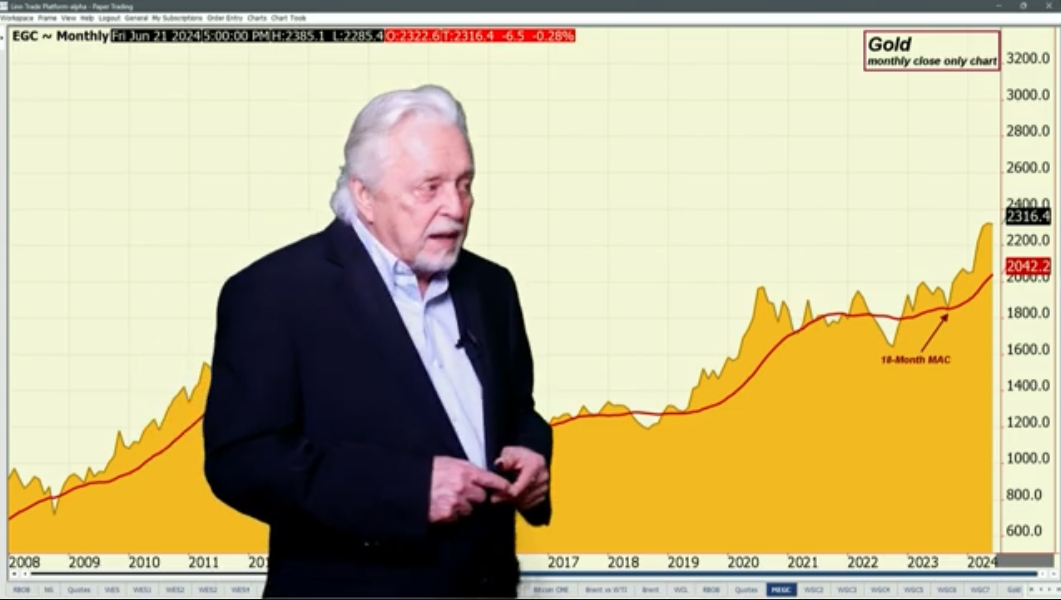
When you and I look at the gold market up and away, but does this look in any manner to you like a bearish situation when when you when you look at a monthly chart? If it does, I don’t know what you’re looking at. Yes, it is down point to 0.28% for this month but it hasn’t gone anywhere.
Look at the weekly chart, you see more of a reaction down 0.64% but this is the first day of the week, so you can see how the market is coming down. The support is the 18-week average; you can see the sideways action when we don’t have anything on a chart and you can see and this is the beauty of it with the swing line – lower highs, lower low so you’re in a downtrend unless you get up and over $2385.10. Should the market break under $2290.5 you still have a downside possibility to get to the 18-day average of $2290.
Read the full article here

