

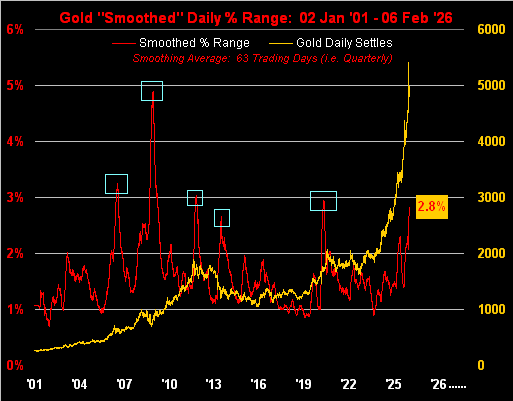
Gold by its daily trading range (intraday low to intraday high, or vice-versa) is establishing point swings “like ya never done seen” –[mmb, ’18]. Gold’s daily range through these first 25 trading days of 2026 has averaged 197 points per session, the current “expected daily trading range” (for Monday) being 283 points, an historical maximum. That is wider than Gold’s entire trading range from the start of the 21st century on 02 January 2001 (opening price 273) for nearly five years until 12 December 2005 (settle price 532).
However: in turning to the reality of percentage swings, Gold’s actually been here before, having yet again arrived at what (at least historically) has been ’round peak volatility. Year-to-date, Gold’s average daily percentage range is 4.2%, including one day of 10.9% and another of 16.6%; (the year’s daily median thus far is 2.6%). All that said, towards subjectively selecting what is peak volatility, we’ve the following graphic spanning Gold’s 6,314 trading days thus far this century. In order to smooth out the daily percentage gyrations of price distance traveled, the red line is a 63-day (one quarter) moving average of range. Note the boxes at the extremes of range (save for the FinCrisis) having peaked just either side of 3%, the current value as of yesterday (Friday) per the label at 2.8%, even as the week’s final session sported an intraday gain of +7.0%, with price (the Gold line) settling at 4989:
“So mmb, you think gold’s gonna slow down, especially as it already reached your forecast high?”
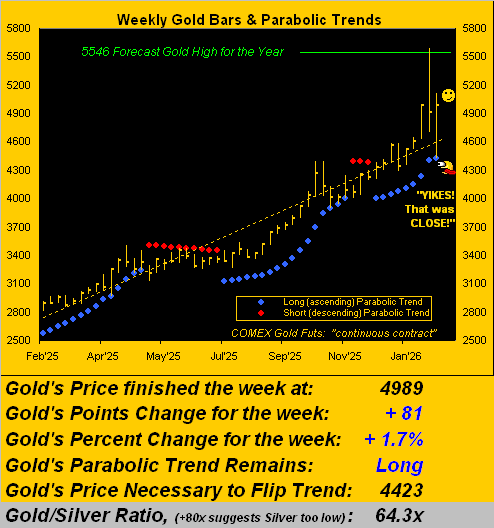
Squire of course is referring to 5546 which traded (and then some to 5586) on 29 January. Then from that All-Time High, price within the two ensuing days fell by as much as -20.8% to 4423. And to Squire’s query if Gold is going to “slow down”, should the mid-5000s not be substantively retested near-term, interest in trading the yellow metal may wane a bit, and certainly so should — by last week’s piece “Metals’ Mania Maxed!” — indeed have become the case.
To wit: following Gold’s April (front month) rollover contract volume of 570k that traded on Friday a week ago (31 January), every day through this past week recorded size declines thereto, chronologically as 508K, 386k, 260k, 246k and yesterday 235k. (Whilst we tend to notice little things like that, doubtless it shan’t be found by the FinMedia).
Furthering our own findings, Gold just completed its ninth week of the blue-dotted parabolic Long trend. And so we go to Gold’s weekly bars from a year ago-to-date wherein price today at 4989 is well-above (+12.8%) the parabolic level for the ensuing week of 4423, despite having nearly flipped to Short this past week (down to just 24 points above the hurdle of then 4399). Yep, it came that close:
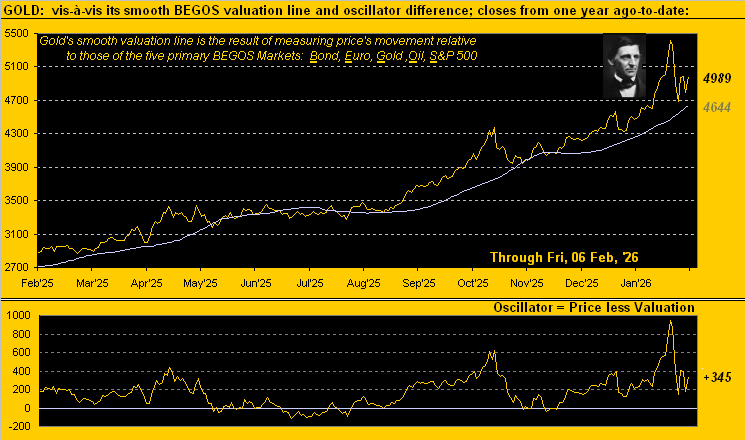
And lest we forget, per R. W. Emerson: “The eye of prudence may never shut.” –[“Essays”, 1841]. We thus duly remind you by the opening Gold Scoreboard of price today being +26.6% above Fair Value (3942), inclusive of it being +7.4% above our BEGOS Market Value (4644), the latter a deviation of +345 points as below charted. You tell ’em, Ralphie:
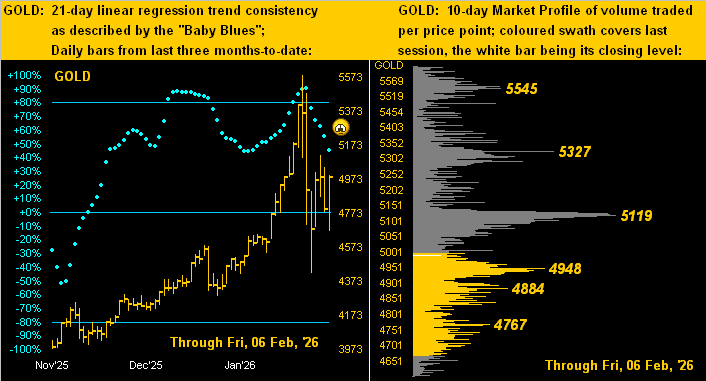
So whilst Gold is still quite overvalued, the “Baby Blues” project the directional news. For as we turn to our two-panel graphic of the daily bars from three months ago-to-date on the left and 10-day Market Profile on the right, the declining blue dots are indicative of Gold’s uptrend losing consistency, (albeit the trend remains up as long as the dots are above their 0% axis). But by the Profile, Gold is below its most volume-dominant resistor of 5119 as labeled:
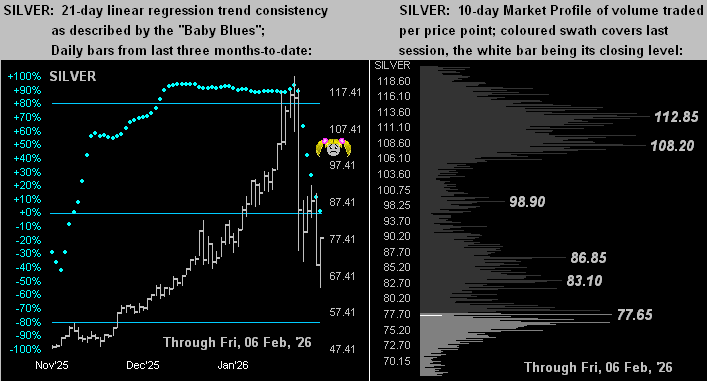
And no, hardly have we forgotten Sister Silver, in whose like graphic the fallout of the “Baby Blues” (below left) is more severe than that for Gold. In setting a record high at 121.79 also on 29 January, through just these past seven trading days Silver slithered down to as low (yesterday) as 63.90. Not so sweet her -48% retreat; but then came a bounce to 77.53 in closing the week. Yet by the opening Scoreboard, Silver is +36.4% above her Fair Value of 56.85. As for her Market Profile (below right), note the dearth of volume from 108.20 down to 86.85. For when the bids bugger-off, the going gets tough! And as overvalued as she is, as we on occasion quip: Poor ol’ Sister Silver!
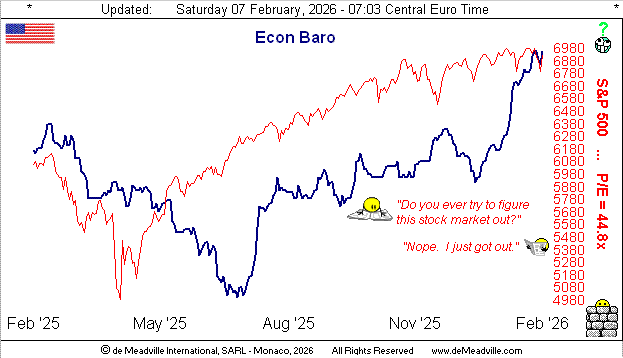
Now: how did the past week’s U.S. government “mini-shutdown” work out for you? Did you even notice it? We did, indeed glaring so with yesterday’s Payrolls data for January being postponed until Wednesday (11 February). Thus for the week, the Economic Barometer brought in just six metrics, the shining star being December’s Consumer Credit, which beat estimates as well as the prior period, itself revised upward. ‘Course, we hope folks’ll have the dough to pay credit’s monthly toll. Or as Senator “Fritz” Hollings (D, South Carolina) would on occasion pontificate ’round the turn of the century: “There’s too much consumin’ goin’ on out there!” especially as job growth slows. For the lackluster loser of the week was January’s ADP Employment data, which missed estimates and was worse than the prior period, itself revised downward. Still, the Baro managed a hitch up to where ’twas a week ago, helped by an improved Institute for Supply Management manufacturing reading for January indicative of expansion (52.6) vs. that of December shrinkage (47.9):
So from six Econ Baro metrics last week, we have 16 scheduled through next week. To be sure, ever since the past autumn’s U.S. government “macro-shutdown”, the stream of incoming data has been nothing short of screwy-louie (technical term). For example, as regards inflation: next Friday brings (per the Bureau of Labor Statistics) January’s Consumer Price Index … but ’tis not ’til the Friday thereafter we receive (per the Bureau of Economic Analysis) December’s Personal Consumption Expenditures. Are we therefore going backward? Ought we commandeer H. G. Well’s time machine –[Taylor, Mimieux, MGM, ’60]?
Indeed we thus could go forward to assess the state of Gold’s volatility (among other things). But that would take out all the fun. Besides, we’ve oft quoted the late, great Richard Russell: “There’s never a bad time to buy Gold.” Yet, ’tis also been said the day to sell your Gold is the day everybody wants it. As overvalued as both Gold and Silver presently are, that “day” remains a long way into the future. So mind and preserve your precious metals!
Cheers!
…m…
www.TheGoldUpdate.com
www.deMeadville.com
and now on “X”: @deMeadvillePro
deMeadville. Copyright Ⓒ 2010 – 2026. All Rights Reserved.
Read the full article here