

With all the global uncertainty in play — from unrepayable debt and overvalued (understatement) equities, to stymied transport of the world’s economic engine (oil) and sorrowfully childish warring (“He bombed me, so I’m gonna bomb him!”) — the trading range of Gold, which as we detailed a week ago had through Q1 been “vehemently volatile”, is now noticeably narrowing. This perhaps is due in part to an allowance of ships through the infamous Strait, as well as 14th-century minds (all ’round) now attempting 21st-century negotiations. On verra…
“But the trading range still is pretty wide, huh, mmb…”
Broadly, Squire, Gold’s ranginess indeed can still be characterized as “wide”, yet of late clearly compressing, as too is that for Silver. Here from a year ago-to-date per the website are the EDTRs (“expected daily trading ranges”) for Gold on the left and for Silver on the right, both well off their respective peaks of recent weeks; (again for you WestPalmBeachers down there, this is not price, rather the expected range thereto from day-to-day):
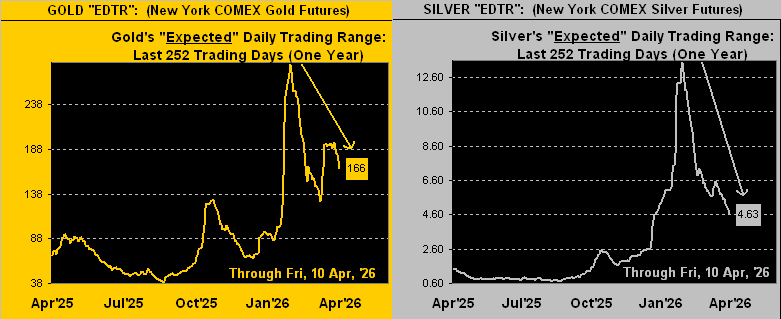
“But with prices up so much from a year ago, how about by percentage instead of points, mmb?”
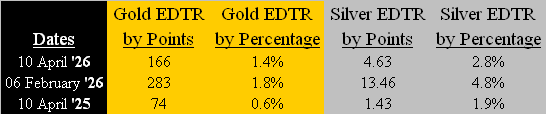
Squire, by either method, precious metals’ volatility today is essentially double that of a year ago, yet as noted, remarkably reduced from the recent price-spiking in February. To wit this table (in reverse chronological order):
The “point” is: with all that is in play these days, the daily trade of both Gold and Silver has become a bit more contained, even if considerable vis-à-vis this time in 2025.
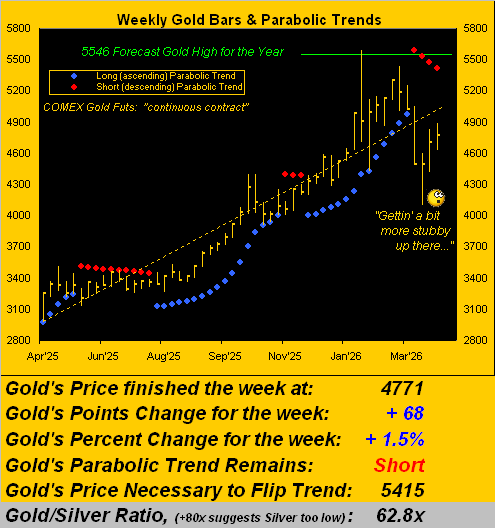
Still, as we turn to Gold’s weekly bars and parabolic trends from a year ago-to-date, notwithstanding a fourth rightmost red Short dot, price has posted both “higher highs” and “higher lows” for two consecutive weeks in perceivably pursuing a return to the ascending dashed trendline. This past week’s low-to-high range of +262 points (+5.7%) ranks narrowest of the past four, despite its expected weekly trading range having anticipated a span of 369 points:
Price too has been recovering relative to its BEGOS Market Value, which as initially depicted in the opening Scoreboard and as below labeled at 5086, is in decline even as Gold settled yesterday (Friday) at 4771, but still -315 points under its smooth valuation line:
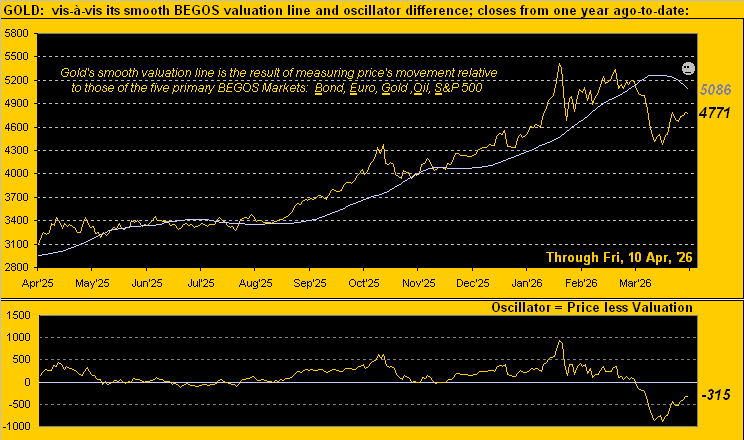
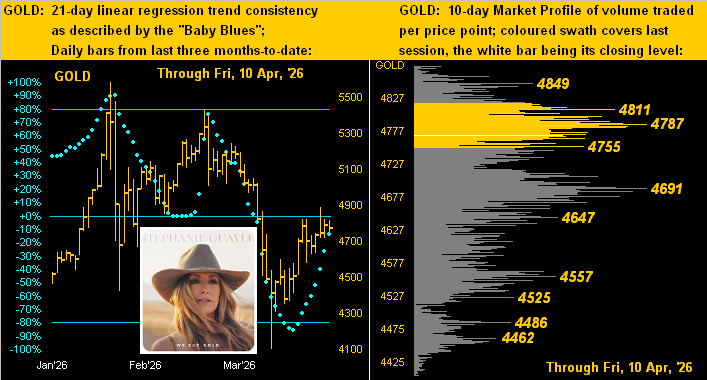
‘Course, that’s been a significant improvement given Gold just back on 26 March was a record -886 points (-16.8%) below said valuation. But more broadly (again per the Scoreboard) Gold today at 4771 is +21.3% overvalued given Fair Value of 3934. Although Gold through its many “discarded relic” years overwhelmingly went unnoticed, today we oft are asked “Is this a good time to buy Gold?”, our “off-the record” response being, “Now is fine, but purposely budget to purchase again upon price returning to Fair Value.” Reference as well Stephanie Quayle “We Buy Gold” –[’21] as we below go to Gold’s two-panel graphic of the daily bars from three months ago-to-date at left and 10-day Market Profile at right. Note the baby blue dots of regression trend consistency continuing to climb: upon their eclipsing the 0% axis, such trend shall have rotated from negative to positive. And by the Profile, Gold’s most immediate support zone runs from 4787 down to 4691:
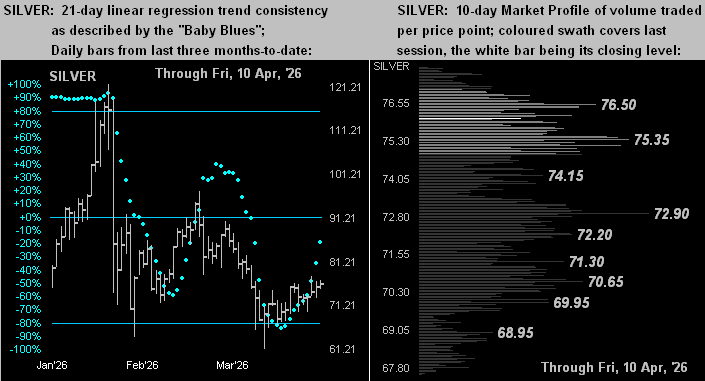
Quite similar is the drill for Silver, although having settled the week at 76.03 finds her a distant +33.9% above Fair Value of 56.77. But as with Gold, Silver’s “Baby Blues” (below left) are rising as her trend becomes less negative, whilst per her Profile (below right) she appears supported down to 72.90. “As overvalued as you are, Sweet Sister Silver, we still love you!”
Now: recall the late, great, heavily Brooklyn-accented Joan Rivers? “Kin we tawk??” … in this case about inflation. Throughout the past two years, we’ve regularly herein displayed our monthly summaries of inflation, time and again citing its rate stubbornly running above the Federal Reserve’s desired annualized target of +2.0%. And yet across all those many months has come the usual FinMedia speculation of “How many times will the Fed cut this year?” Thus rolls on the Investing Age of Stoopid wherein actually performing math has become comprehensively replaced by people parroting what everybody else says and posts. But has the time now finally arrived to “pay the piper”, (i.e. raise rates)? Here’s our inflation table for February, now sporting the most over-extended “above target” paces in recent years. And that’s pre-war, Folks:
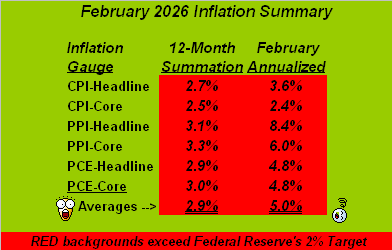
But wait, there’s more: warringly exacerbated by disruption to “the free flow of Oil at market prices” (hat-tip RHL), the “headline” release yesterday by the U.S. Bureau of Labor Statistics of the Consumer Price Index for March of +0.9% was its fastest monthly inflation pace in nearly four years, (since the +1.3% reading for June in 2022 as markets accelerated back to work post-COVID). However, assuming that neither do you drive nor eat, the “core” release was again just +0.2%. (Relieved?)
‘Course, the Fed’s stance to cut its FundsRate had been rooted in weak employment data. But as we know from a week ago, the StateSide jobs picture for March improved well-beyond consensus expectation. And even as the Economic Barometer took a bit of a dip this past week with just four of its 15 incoming metrics having improved period-over-period, the Baro’s overall strength from July a year ago combined with the ever-more harrowing inflation data well-suits the Fed for a rate rise instead. The next Open Market Committee Policy Statement is due 13 trading days hence on 29 April, but expect a lot of geo-political play and effect in the balance. Meanwhile, here’s our year-over-year Econ Baro view:
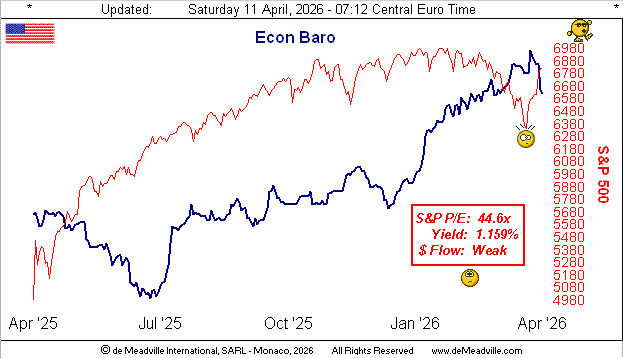
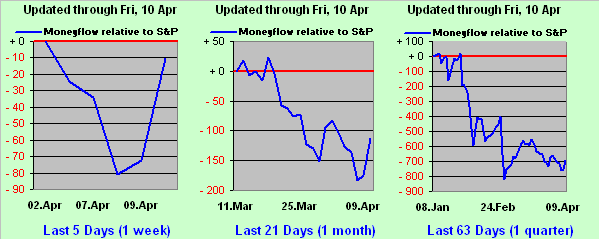
And specific to the practically yieldless S&P 500, is the average investor about to step off the price cliff, or be willing to pay $44.60 for something that “earns” $1? If you follow our leading MoneyFlow page, you know just how weak is the Flow, lacking on balance very little “go”, despite a “cease-fire” bump as below shown. For by the broadest MoneyFlow measure (the right-hand panel’s cumulation from three months ago-to-date), the S&P “ought be” some -700 points lower than its current 6817 price. But as usual, it takes time for the investing community to figure that out…
…and hardly shall the now underway Q1 Earnings Season find bottom lines for the S&P having doubled, (which for those of you scoring at home would halve the price/earnings ratio to a more realistic level). Fortunately with Gold, you’ll always be on the right level!

“Oh now yer really ‘tawkin’, mmb!”
Absolutely, Squire.
Cheers!
…m…
www.TheGoldUpdate.com
www.deMeadville.com
and now on “X”: @deMeadvillePro
deMeadville. Copyright Ⓒ 2010 – 2026. All Rights Reserved.
Read the full article here