
“Gold Morphs into a Meme Stock“
Remember this ol’ tagline from the ’70s? “When E.F. Hutton talks, people listen!”
Fast-forward to today and ’tis “When Goldman talks, people pile on!” For the Morgans et alia, too, the same holds true.
Far be it from The Big Houses to facilitate mathematical justification. Rather:
- Just announce “Here comes 4000 Gold, for recession shall unfold!”;
- Then reprise Tag Team from ’93 with “Whoomp! (There It Is)”;
- And in mere hours Gold morphs into a straight up meme stock as if ’twere GameStop.
In that same critical vein, this past week a fine friend and valued colleague shared these words from Mark Clubb, Executive Chairman at the wealth/asset management financial services firm TEAM PLC: “…there is undoubtedly too much noise in financial advice today … dressed up as wisdom and too many professionals repeating slogans instead of offering substance…” We agree.
Regardless: if “4000 Gold!” is the call, let’s just immediately put price there. “We don’t need no stinkin’ analysis!”
For more perspective we’ve this. Across the 644 months which have passed since President Nixon nixed The Gold Standard back in ’71 — with still three trading days left in this April’s balance — Gold has already set the record for its largest intra-month low-to-high points-gain in history: +540!
Impressive as well on a percentage basis, the +18.2% intra-month gain ranks 15th-best since said nixing. As for the 14 other even-better intra-month gains, Gold on average then fell by -11.7% within three months, suggesting that sub-3000 from here is very realistic moving forward. ‘Tis just the way Gold has traded — at least historically — once the euphoria wears off.
Still, here’s a real show-stopper: from January’s low just three months ago (2625), Gold has come to within 115 points of having gained $1,000/oz! Cue the late great “Bullet” Bill King: “Holy Toledo!!”
‘Course, there’s still the party-pooper fly in the ointment — for just as do meme stocks — following Gold’s latest All-Time High of 3510 recorded this past Tuesday, price come Wednesday fell as much as -239 points (-6.8%) to 3271 toward settling the week yesterday (Friday) at 3330. No, Gold did not reach down to the 3237 Market Profile support level as prognosticated a week ago; but by our near-term technical BEGOS Markets Value measure, price remains +302 points too “high”:
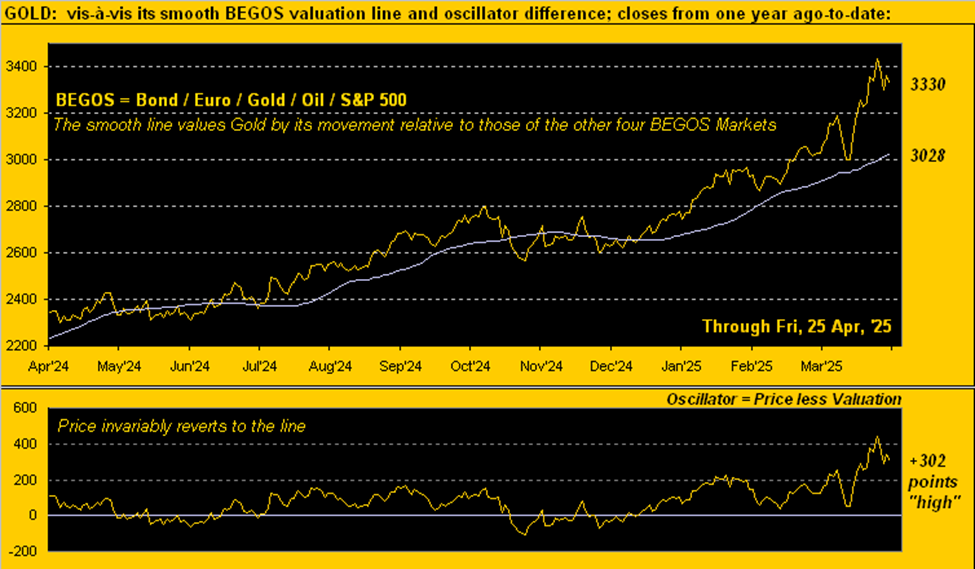
And as it has always done, we anticipate Gold (3330) sorting itself out with respect to the above chart’s BEGOS valuation (3028), such rising smooth line itself this past week having averaged a daily gain of +8 points.
More importantly of course, by the opening Gold Scoreboard, the yellow metal’s supply-adjusted Dollar debasement value (3875) remains the broad-term goal. And therein note: the liquid StateSide money supply (“M2” basis) just set its own record high, now $22,149,197,787,444.50, (which for you WestPalmBeachers down there reads as “Twenty-two trillion one hundred forty-nine billion one hundred ninety-seven million seven hundred eighty-seven thousand four hundred forty-four dollars and fifty cents”).
Indeed, every Lincoln counts…

…and unfortunately, hardly is there enough liquidity to cover the S&P 500’s current market capitalization of $48.7T. Thus: at least halve the current “live” price/earnings ratio (42.3x) to avoid the “Look Ma! No Money!” crash.
“But then it already will have crashed, mmb…”
Squire’s brevity of brilliance oft qualifies as the last word. Yet there’s hope: for if the effect of “TT” (“Trump Tariffs”) positively plays out such that the U.S. makes its own stuff and earnings double, then also avoided is the “Look Ma! No Earnings!” crash. But we digress…
To progress back to Gold, its continuous futures contract volume these past five days (1,765,217) was the most since the COVID-crippling week ending 14 August 2020, (soon after price had eclipsed 2000 for the first time).
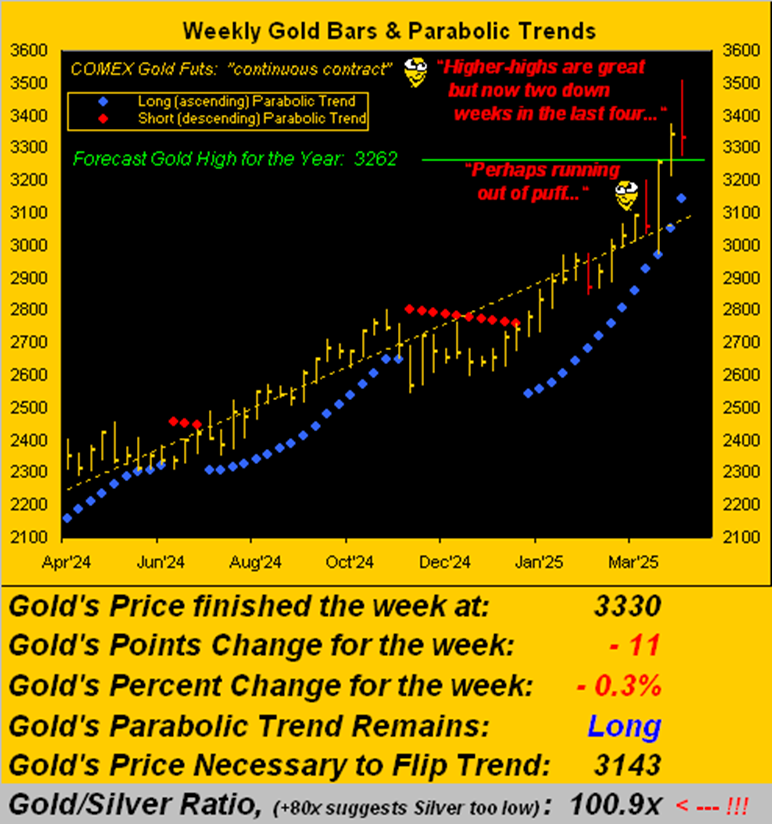
Now this year-to-date, 17 trading weeks already are in the books with just three of them having been down. But: in accordance with the aforeshown Market Value graphic of Gold being +302 points “high”, two of the past four weeks have been down. So is it finally being perceived that — near-term — Gold perhaps has gone “A Bridge Too Far” –[U.A. ’77]? Here are the weekly bars from a year ago-to-date, the three downers during 2025 in red:
Moreover, in walking to coffee this morning we encountered an esteemed gentleman who actively trades the precious metals futures, notably so Silver, which has been in part excluded from Gold’s rally. We exclaimed: “Wow, the Gold/Silver ratio this week reached 107x!” to which he replied “Yes, but it is Gold that has gone way too far too fast!” So for those of you scoring at home, just a little perspective from the quiet shores of our wee Mediterranean fishing village.
Still (as noted at the foot of the above graphic), the Gold/Silver ratio settled the week at 100.9x. ‘Tis not nearly the highest reading century-to-date (having reached 124.2x on 18 March 2020 in the COVID chaos); all-in, the ratio’s average since 2001 is 68.9x. Silver priced today to that average — rather than being the current 33.02 — would instead be +46% higher at 48.31, ever so near the white metal’s own All-Time High of 49.82 away back now 14 full years ago on 25 April 2011.
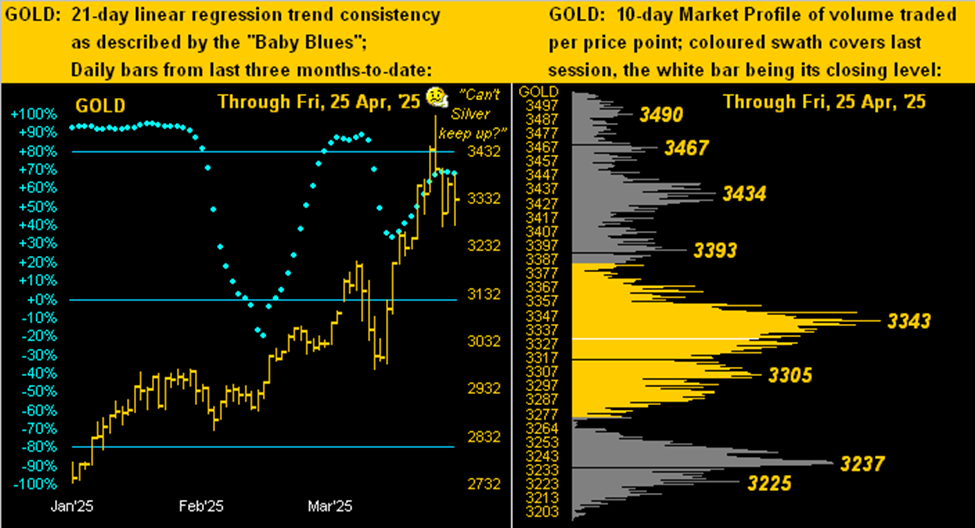
Indeed as we go to Gold’s two-panel graphic of the daily bars from three months ago-to-date on the left and 10-day Market Profile on the right, ’tis queried “Can’t Silver keep up?” Yet, note the baby blue dots of trend consistency are at least momentarily running out of puff without having reached up to the key +80% level: that suggests lower prices are nigh. And by the Profile we can see the magnitude of Gold’s rapid pullback from this latest 3510 All-Time High:
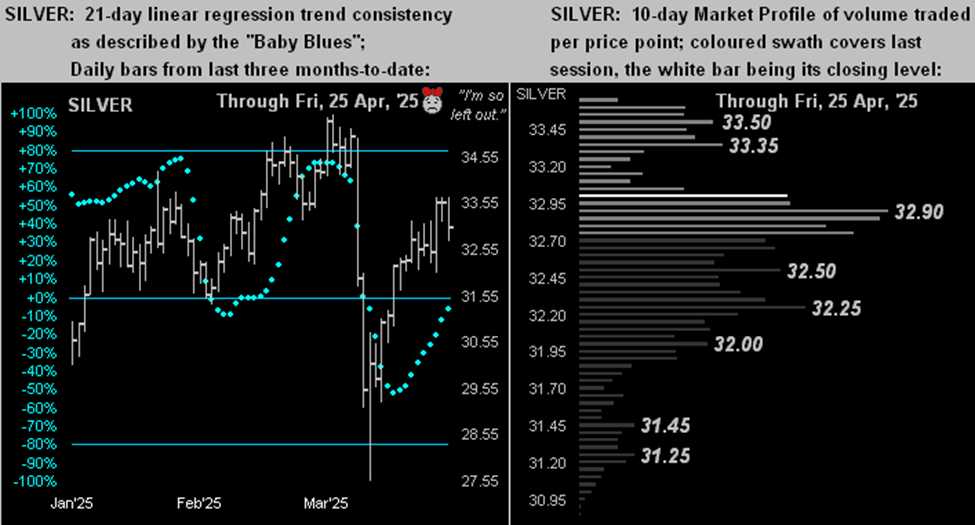
With the like graphic for Silver, all she can say is “I’m so left out.” Even though she’s actually been in a rally mode these last three weeks, on a month-to-date closing basis Silver is net down -5.0% from 34.77 to 33.02, whereas Gold is net up +5.5% from 3157 to 3330. We’ve said it before and we’ll say it again: “Poor ol’ Sister Silver!” Of course, blame it on Cousin Copper whose having dragged Silver into mischievous deeds finds the red metal down -4.1% month-to-date. That’s our Sweet Sister Silver as — given Gold and Copper — she’s “Torn Between Two Lovers” –[Mary MacGregor, ’76]:
Toward wrapping it up for this week, the StateSide economy has gone to sleep, even as “TT” shall it eventually tweak, if as we’re so led to believe.
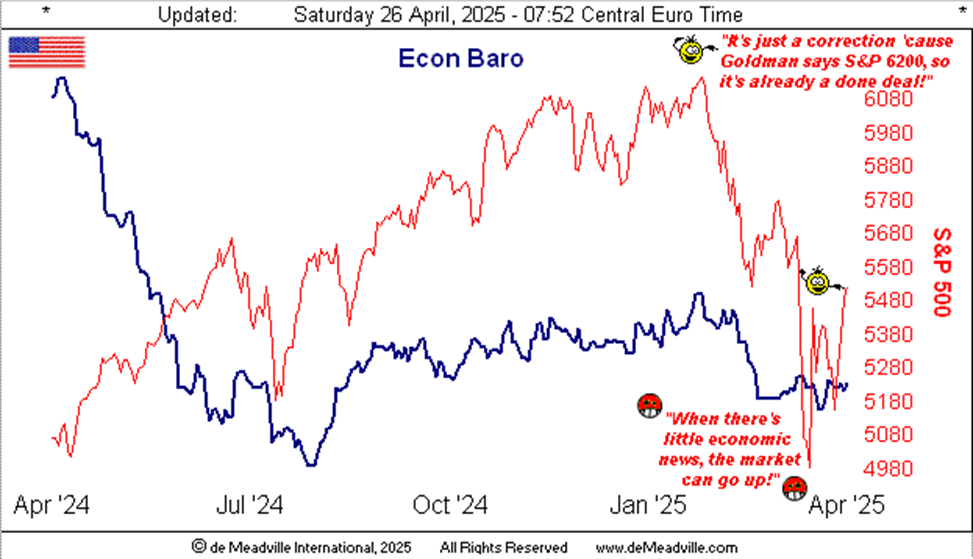
Similar to what we’d seen the prior week, this past one brought but six metrics into the Economic Barometer: period-over-period, three improved and three worsened. Either way, as the high-level financial professionals below depicted in the Econ Baro tell us, the S&P 500 (which month-to-date is barely down -1.5%) loves “no news” and further, “S&P 6200 is a done deal”:
But then there’s next week: 18 metrics come due for the Baro, including that breath-holding, “Fed-favoured” inflation gauge of Personal Consumption Expenditures for March. The Bureau of Labor Statistics already found March to be deflationary! Will the Bureau of Economic Analysis find same via the PCE? Likewise, shall the first peek at Q1 Gross Domestic Product be negative? So anticipates Raphael “Reality” Bostic’s Federal Reserve Bank of Atlanta. Either way: prepare the popcorn!
Still, at the end of the day, ’tis all ok. Despite fears of recession, “TT”, and unsupportive earnings, we’re nonetheless told to expect “S&P 6200!” For as decreed Yul Brynner in the role of Pharaoh Rameses I of Egypt –[The Ten Commandments, Paramount, ’56]: “So let it be written; so let it be done!”
‘Course what really need be done is — meme as it may be — hold Gold whilst on a Silver shopping spree!

Cheers!
…m…
www.TheGoldUpdate.com
www.deMeadville.com
and now on “X”: @deMeadvillePro
Read the full article here