
Is Gold in a weekly parabolic Short trend? Yes. Indeed, have four of the past six weeks been net down for Gold? Yes. Including this last one? Yes. Even with +27 points of fresh August premium just added to present price? Yes.
Yet with August Gold settling the week yesterday (Friday) at 3313, price nonetheless is +162 points above that contract’s 3151 low of two weeks ago. To be sure, Gold just completed its third week of this relatively new parabolic Short trend; but overall, price’s fall from the 22 April All-Time High of 3510 (basis June) appears more as a stall. Let’s start with the weekly bars of Gold’s “continuous contract” from one year ago-to-date, (the August-only contract changes as noted in the right-hand margin):
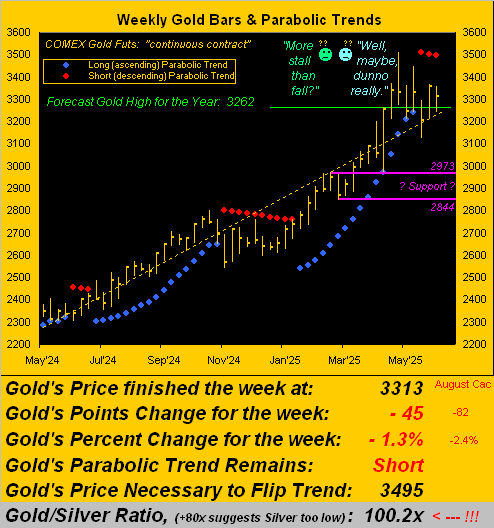
As to the depicted 2973-2844 structural support area, we feel it prudent to maintain that zone on the weekly graphic during the continuance of this Short trend, be there a more material price fall rather than merely this transitory stall. For after all, Gold now at 3313 remains priced at a discount (-13%) to the opening Scoreboard’s Dollar debasement value of 3823. Still, demonstrably it can take years if not decades for price to catch up. ‘Course, the 18-month $1.5T dip in the StateSide “M2” money supply from $22.1T (18 April ’22) down to $20.6T (30 October ’23) allowed Gold to catch up a bit during that stint by some +6%.
Moreover: given the the S&P 500’s current market capitalization of $52.0T being supported by today’s “M2” liquidity level of “just” $21.9T — upon it all going wrong and the Federal Reserve being called upon to “make up the difference” — the bid for Gold shall be impressive, (which for you WestPalmBeachers down there means the price shall skyrocket).
And indeed year-to-date, Gold has already put on quite a fireworks display, running up and away from the pack of the other BEGOS Markets as we turn to their standings by percentage change through these first five months of 2025, the Metals Triumvirate yet again populating the podium:
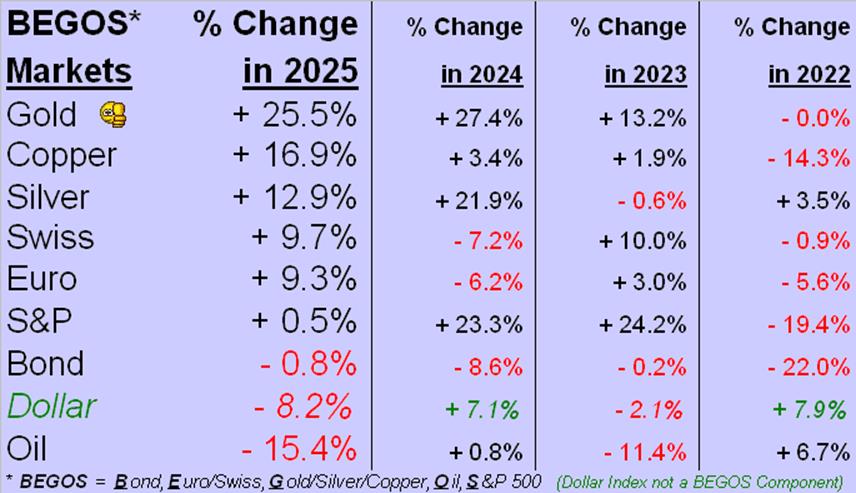
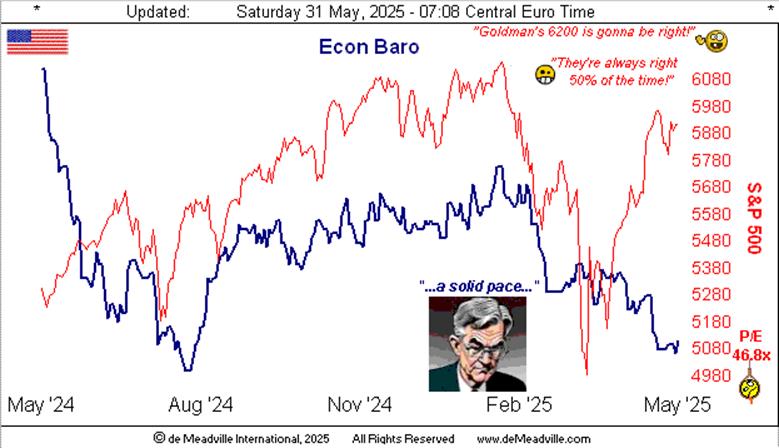
Note therein the S&P 500 being barely above water (+0.5%) to this point. Currently 5912, the mighty Index is but -4.6% below Goldman Sach’s trimmed target of 6200. But as we’ve ad nauseam gone on, sustaining a price/earnings ratio of now 46.8x with a wee yield of 1.305% versus the U.S. three-month T-Bill’s annualized 4.232% is delusionary. (Unless the Treasury defaults, in which case the stock market would not crash; rather ‘twould simply close … until at least, again, the Fed “makes up the difference”). Got Gold?
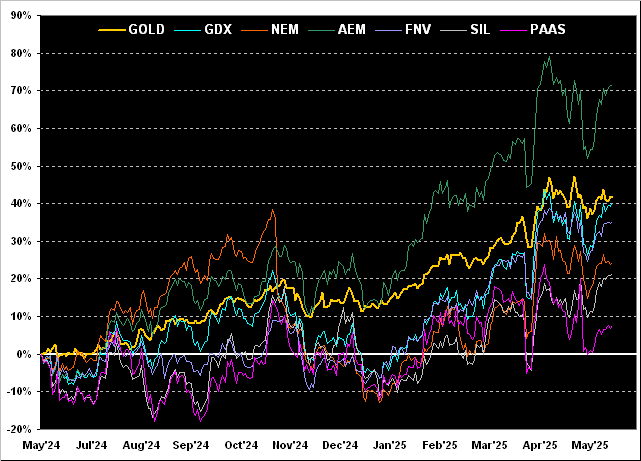
Next we’ve got Gold’s percentage track from one year ago-to-date along with those of highly visible precious metals equities. Ranking from worst-to-first, they presently are Pan American Silver (PAAS) +8%, the Global X Silver Miners exchange-traded fund (SIL) +21%, Newmont (NEM) +24%, Franco-Nevada (FNV) +35%, the VanEck Vectors Gold Miners exchange-traded fund (GDX) +40%, Gold itself +42%, and Agnico Eagle Mines (AEM) +71%. Some might query why the equities haven’t (with the exception of AEM) outpaced Gold’s year-over-year +42% gain; but obviously it all depends upon from what point in time the measurements start. Regardless, the graphic does exhibit the leverage of the equities being far more oscillative than the track of Gold itself … which for those of you scoring at home emphasizes the importance of timing one’s equity trades:
Speaking of time, did you spend some pouring over the Federal Open Market Committee’s 06/07 May meeting minutes? This again caught our eye: “…economic activity continued to expand at a solid pace … inflation remained somewhat elevated…” Why an eye-catcher? Because by our math, the Economic Barometer since mid-February notably has been weakening, and inflation (as reported) cooling toward more Fed-friendly levels.
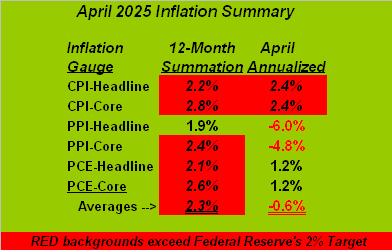
Let’s first look to the latter per our inflation summary for April via the usual six measures. To be sure, the 12-month summations of each element are basically atop the Fed’s +2.0% target (red backgrounds). But take note of April alone as annualized: yes, the Consumer Price Index came in a bit warm; however the more-leading Producer Price Index was DEflationary. Further the “Fed-favoured” gauge of Personal Consumption Expenditures — again annualizing only that for April — was well-below target. The FOMC’s next Policy Statement is scheduled for 18 June. “To cut? Or not to cut?” ‘Twill be the question:
And second let’s go to the Econ Baro, for which — of the past week’s 11 incoming metrics — only four improved period-over-period. The Gold Star goes to April’s marked increase in Personal Income, the +0.8% gain being the best since that of January 2024; but the Pyrite Pooper is awarded to April’s Pending Home Sales, the -6.3% shrinkage the worst since the same month a year ago. And thus here’s the Baro:
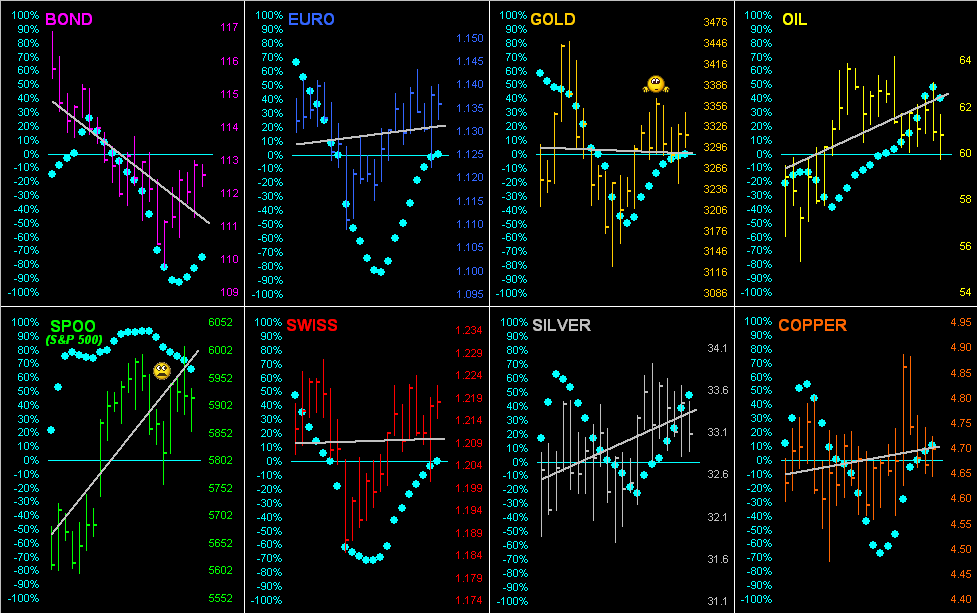
Meanwhile, it being month-end, ’tis time to go ’round the horn for all eight of our BEGOS Markets across the past 21 trading days, replete with their respective grey trendlines and “Baby Blues” of each trend’s day-to-day consistency. Gold’s trendline has nearly rotated from negative back to positive, but again, there’s that darn weekly parabolic Short trend with which to contend. However, more daunting in the graphic are the blue dots for the S&P 500 (SPOO futures) which are dropping by the day even as the Index struggles to gain some traction. Oh yes, the S&P’s trend remains up, but we regard last Thursday as a “failure day” for the futures: after having being up intra-day a very robust +1.4%, they gave it all back and then some, settling in the red, with further fallout into Friday. So for the S&P ’tis up with the trend but down with the Blues … someone’s got to lose:
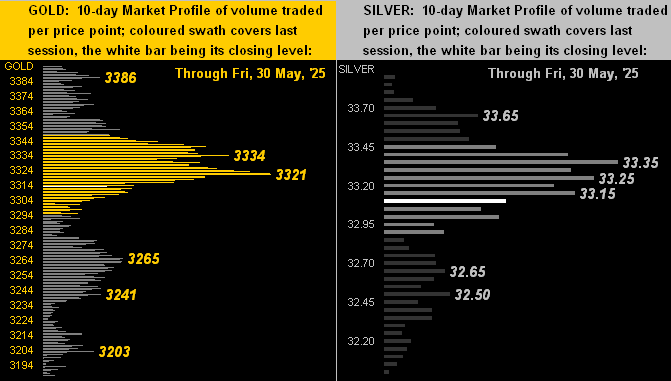
Now let’s assess the 10-Market Profiles of the precious metals. For both Gold (below left) and Silver (below right), price is presently beneath the most heavily-traded apices in the respective panels. And as labeled, Gold’s most dominant overhead resistor is 3321 (basis the current August “front month” contract) whilst for Silver ’tis 33.35:
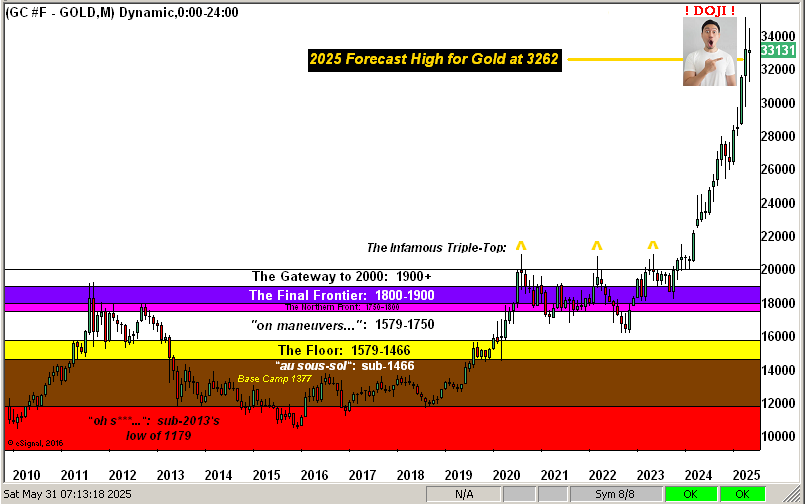
So with May in the books we next look at Gold’s Structure by the month across these past 16 years. And therein note our friend vehemently making reference toward the rightmost candle for May: ’tis a “doji”, which in Japanese candlestick charting means price’s period was both — indeed nearly equally — higher and lower, only to close basically back where it started. By Gold’s August contract, May’s first trade was at 3329 and last trade just -16 points lower at 3313, even as the month’s high-to-low range spanned 326 points. So what is the analytical interpretation of a “doji”?
“That the trend is about to change, mmb.”
So ’tis said, Squire. Thus in this “doji” case, given that Gold more broadly has been going up — by process of elimination — a trend change would be to down. ‘Tis quite a bit of near-term conflict for Gold: price had been flying, yet more recently stalling rather than materially falling, but the weekly parabolic Short trend remains calling. Again, mind Gold’s aforeshown 2973-2844 support structure. As to “The Now”, here’s Gold’s magnificent picture:
And just like that, five months of 2025 already are gone. Or as a fine friend over in the States is wont to say, as we age: “It goes quickly.”
But back in the late 18th century, the sixth President of the Commonwealth of Pennsylvania (one Benjamin Franklin) lived to be 84 years of age, far more than double the male longevity expectancy of then just 36 years. And “quickly” or otherwise, ol’ Ben is still going in continuing to grace the face of today’s $100 Federal Reserve Note. ‘Course in 1928, he already was on the Treasury’s $100 Bill, which as a Gold Certificate was thereto redeemable. In those days, Gold was fairly fixed-priced at $20.67/ounce, the $100 Bill thus convertible into 137 grams of Gold…
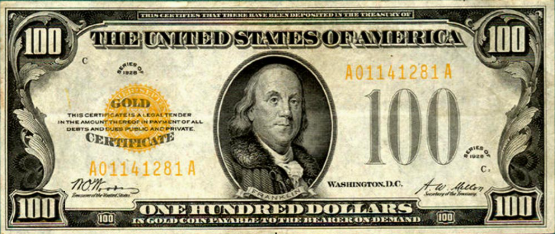
…whereas today’s $100 fetches less than one gram, (0.85 grams or 0.03 ounces).
Therefore: a lot can happen in less than 100 years. Shall your potentially centenarian children have enough to survive a century? Reprise: “Got Gold?“
Cheers!
…m…
www.TheGoldUpdate.com
www.deMeadville.com
and now on “X”: @deMeadvillePro
deMeadville. Copyright Ⓒ 2010 – 2025. All Rights Reserved.
Read the full article here