Investors chasing gold’s upside momentum was a major driver of its recent surge. Their relentless capital inflows helped catapult gold up to extraordinarily-overbought levels, really ramping risks for a reversal. As that indeed sure looks underway now, investors’ chasing has also turned on a dime to fleeing. While their capital outflows haven’t grown large yet, that selling could easily snowball deepening gold’s drawdown.
Gold investment demand is challenging to measure. The best-available data is only published once per quarter in the World Gold Council’s fantastic Gold Demand Trends, well-written must-read reports for all gold and gold-stock investors. Overnight into Thursday, the new Q3’25 version was just released. Like usual, it analyzes gold’s global supply-and-demand dynamics that fueled its enormous 16.5% rally last quarter.
Gold’s investment demand proved its biggest category in Q3, just under 3/7ths of overall total demand. The WGC has long subdivided that into bar-and-coin demand and gold-ETF demand. Physically-backed gold exchange-traded funds buy, hold, and sell actual gold bullion. So tracking their holdings reveals investment-capital flows into and out of gold. Gold-ETF buying was gold’s fastest-growing demand category in Q3.
Bar-and-coin demand last quarter grew 16.8% YoY to 315.5 metric tons. But gold-ETF bullion demand skyrocketed 134.2% YoY to 221.7t! The WGC also tracks the world’s biggest physically-backed gold ETFs quarterly. The largest has always been the American GLD SPDR Gold Shares, which has maintained an unassailable first-mover advantage since effectively birthing gold ETFs in mid-November 2004.
The second-biggest has always been the American IAU iShares Gold Trust launched not much later in mid-January 2005. IAU has one key advantage over GLD that has left it more favored among many fund investors. IAU charges annual management fees of 0.25% of net assets, well under GLD’s 0.40%. In the super-competitive fund space, every basis point of returns matters. GLD and IAU have always dominated.
Exiting Q3, these two behemoths alone commanded 38.9% of all the gold held by all the world’s gold ETFs! Two UK gold ETFs were third and fourth with 6.3% and 5.7%, and a German one was fifth running 4.6%. But sixth place is really interesting, another way-newer American one called GLDM SPDR Gold MiniShares. Born far later in late June 2018, it was designed to make gold ownership more accessible.
Its big-brother GLD under the same management is based on each share being worth 1/10th of an ounce of gold after cumulative annual management fees. GLDM tracks a smaller 1/50th of an ounce, making for a proportionally-lower share price for investors. But GLDM’s knockout advantage is its annual management fees are only 0.1% of net assets, merely 1/4th of GLD’s! So GLDM has to be cannibalizing GLD demand.
In Q3 GLD+IAU+GLDM holdings surged 7.8% or 120.7t. GLD grew 6.3% or 60.3t, IAU 8.9% or 39.2t, and GLDM enjoyed the strongest growth at 14.3% or 21.2t. They were much better than all the rest of the world’s physically-backed gold ETFs combined, as their collective holdings only climbed 4.9% or 101.0t last quarter. GLD+IAU+GLDM holdings are a great proxy for American stock investors’ gold capital flows.
While gold clocked in with that fantastic Q3 up 16.5%, it wasn’t particularly overheated yet. Most of the frenzied buying arose in the first several weeks of October, which the WGC’s Q3 report doesn’t cover. In that short span, gold blasted another 12.9% higher stretching an extraordinarily-extreme 33.0% above its baseline 200-day moving average! I had warned about gold’s mounting overboughtness and downside risk.
That also ballooned gold’s mighty cyclical bull since early October 2023 into its largest on record going way back to January 1971! In a mid-October essay on gold’s biggest bull ever right before it peaked, I warned that “History argues a 20%ish drawdown is probable, which gold stocks will leverage 2x to 3x like usual.” The next-ten-biggest gold bulls averaged subsequent big-and-fast gold selloffs of 20.8% over just 2.1 months!
One of the main reasons gold’s massive breakout accelerated so dramatically in October’s first few weeks was American stock investors increasingly chasing gold’s powerful upside momentum. In that short span this month when gold blasted up another 12.9%, GLD+IAU+GLDM holdings surged fully 3.8% or 62.9t! Again that compares to 7.8% and 120.7t for all of Q3, which was fully 3.6x longer in terms of total trading days.
Because American stock investors’ capital flows have been one of gold’s major price drivers for well over a decade now, I’ve done a lot of past research work on them. In mid-February 2025 before investors started chasing with GLD+IAU+GLDM holdings at just 1,372.2t compared to 1,696.7t midweek, I wrote an essay Americans to Chase Gold. In mid-July with holdings at 1,538.6t, I wrote another one Gold Chasing Mounts.
One key thing past gold-ETF-holdings research revealed was their major reversals tended to lag gold’s own. In past major gold toppings, GLD+IAU+GLDM holdings would usually continue building for several weeks or more after gold crested. That implied American stock investors weren’t convinced those gold runs were over, so their differential gold-ETF-share buying persisted until it was clearer gold was rolling over.
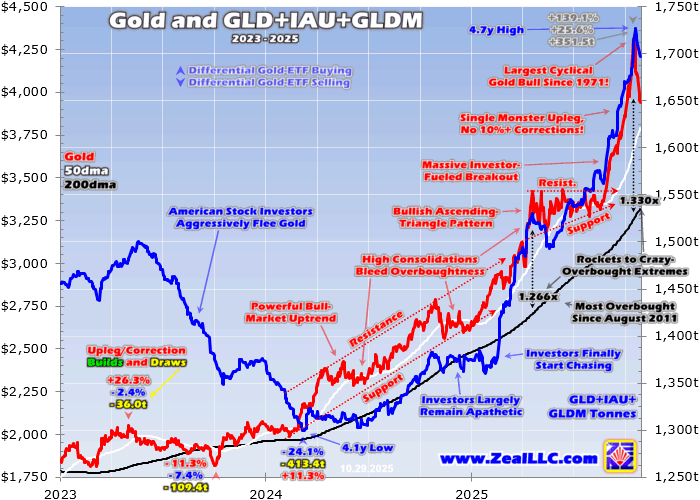
But rather provocatively this time around, these dominant gold ETFs’ holdings look to have peaked right with gold. This chart superimposes GLD+IAU+GLDM holdings over gold prices during these last few years or so. While this is all still young, it sure looks like American stock investors’ gold chasing has already reversed with gold! This is certainly bearish, as gold-ETF selling pressure could easily cascade.
Gold’s latest record high was $4,350 on October 20th, capping that amazing 12.9% month-to-date surge. GLD+IAU+GLDM holdings technically crested the next day, but with a mere 0.1% build. Their daily builds in the prior three trading days including gold’s apparent topping were far-larger running 0.9%, 0.6%, and 0.7%! So for all intents and purposes, these gold-ETF bullion holdings peaked simultaneously with gold.
Had the usual post-gold-topping lag happened where differential gold-ETF-share buying continued for a few weeks or longer, that would’ve moderated gold’s nascent selloff. I suspect that didn’t happen because gold’s initial daily drop proved so darned violent. On the 21st right off that latest high, gold plummeted 5.3% which ranked in its top-0.3%-biggest down days since January 1971! I analyzed that in last week’s essay.
The faster any plunge, the more they shock traders and forcibly change their herd sentiment. As gold was soaring into its latest peak, gold bullishness was universal. Major financial-media outlets were falling all over themselves running endless stories about gold’s strong gains and why they were likely to continue. CNBC, Bloomberg, and the Wall Street Journal were starting to feel like they were all-gold-all-the-time.
Not only was the frequency of gold reporting increasing, but its near-term bullishness. In early October a parade of billionaire hedge-fund managers and widely-respected investors were interviewed predicting much-higher gold prices still within the coming half-year. All that hype was getting frenzied, threatening to morph into a secular-bull-slaying popular speculative mania. Gold greed and euphoria were rapidly mounting.
With a psychological backdrop like that, there was little contrarian commentary about the risks of gold’s extraordinarily-extreme overboughtness. Despite intensely studying gold, actively trading gold stocks, and writing about all of it continuously for over a quarter-century now, I got plenty of flak from daring to point out how stretched gold just looked historically. Caught up in the hype, few wanted to view gold soberly.
So gold’s 39th-largest down day in 54.8 years hit gold-bewitched investors like a sledgehammer to the skull! Gold suddenly being clubbed like a baby seal out of the blue on no news catalyst had to be deeply unsettling for investors recently buying in high to chase. That was certainly a brutal wake-up call that gold has always been volatile and risky, and can’t power higher linearly indefinitely. Periodic selloffs are inevitable.
For grizzled battle-scarred veterans, gold plunging out of some of its most-extreme overbought conditions ever was no surprise. I started warning about that increasing likelihood in mid-September when gold was already pretty stretched. We had stopped adding new gold-stock trades in our popular weekly newsletter in mid-August, then tightened up their trailing stop losses in late September. The writing was on the wall then.
In mid-October when the gold-to-the-moon hype was deafening and overboughtness soaring, we added put options in GLD and a major gold-stock ETF. The entire modern history of gold argued that it couldn’t sustain such incredibly-overbought levels for long. But the great majority of investors not considering any studied contrarian perspectives likely had no idea what was coming. They figured gold would keep surging.
While momentum-chasing buying is powerful while underway as gold demonstrated in October’s first few weeks, it is brittle. When that fast-rallying price action wobbles then reverses, hot-money demand quickly vanishes. That leaves sellers in control, and the faster they force prices lower the more pressure exerted on recent investors to flee. In turn the more they sell, the more prices drop fueling snowballing capital outflows.
As of Wednesday’s data cutoff for this essay, gold had already plunged 9.5% in just seven trading days! That already proved the biggest drawdown of gold’s mighty 139.1% cyclical bull over 24.5 months since early October 2023. And gold was challenging a 10%+ correction, which would technically kill this epic gold bull. After cresting a single day past gold, GLD+IAU+GLDM holdings have fallen six trading days in a row.
That’s the longest streak of daily draws since mid-November 2024, during this gold bull’s previous largest selloff of 8.0%. The total GLD+IAU+GLDM holdings drop recently is 1.7% or 29.8t. Gold’s other primary driver in recent decades has been American speculators’ leveraged gold-futures trading. Normally with no government shutdown, their collective positioning is published weekly in Commitments of Traders reports.
Those are current to Tuesday closes, so CoT weeks end every Tuesday. During this latest one wrapping up this Tuesday, GLD+IAU+GLDM suffered a big 1.5% or 26.6t holdings draw. Rather forebodingly, that proved the biggest single-CoT-week draw in gold’s entire record cyclical bull! This recent differential gold-ETF-share selling not only didn’t lag gold, but it has already been the most intense this bull has yet witnessed.
American stock investors’ potential gold exodus cascading is a serious downside risk for gold already in a big-and-fast drawdown. The mission of physically-backed gold ETFs is to track the gold price. But the supply and demand of their shares are independent from gold’s own. So when gold-ETF shares are dumped faster than gold itself, their share prices threaten to decouple from their metal to the downside.
The only way gold-ETF managers can avert such failures is to buy back enough of their shares to absorb any excess supply. They raise the funds to finance these purchases by selling some of their gold bullion. So draws in GLD, IAU, or GLDM holdings reveal American stock-market capital flowing out of gold. And as this chart shows, investors still have lots of room to sell after those holdings paced gold’s massive breakout.
From mid-April to late August, gold was mired in a high consolidation after its previous episode of extreme overboughtness. And mid-April’s was considerably less extreme than mid-October’s. Gold’s upper resistance this past summer ran near $3,425. Gold didn’t break out above that until August’s final trading day, which kicked off recent months’ chasing. The day before that breakout, GLD+IAU+GLDM holdings ran 1,576.8t.
They surged 9.5% or 149.6t into mid-October as gold-ETF shares were bought much faster than gold. In that scenario of excess gold-ETF-share demand, their prices risk decoupling from gold to the upside. So gold-ETF managers issue new shares to offset that excess demand. They then plow the proceeds from those share sales into buying more physical gold bullion. These numbers can be rounded to 1,575t and 150t.
As gold plunged 9.5% since mid-October, American stock investors sold enough gold-ETF shares to force a 29.8t holdings draw. That’s close to 30t, or just 1/5th of the frenzied GLD+IAU+GLDM holdings build in September and the majority of October! What happens to gold prices if investors force another 45t draw unwinding half their recent frenzied build? What if they roundtrip the whole thing to 150t with 120t more selling?
Any more significant differential gold-ETF-share dumping will almost certainly exacerbate gold’s drawdown. Again previous massive gold bulls averaged big-and-fast subsequent selloffs around 20% over a couple months or so. Another one this time around implies $3,480 gold before the dust settles, which is hardly apocalyptic. Gold only first bested that level just two months ago on September’s opening trading day.
But the pain of a 20% drawdown would still be serious, especially in gold stocks. Historically the leading GDX gold-stock ETF has tended to amplify material gold moves by 2x to 3x. So if American stock investors’ gold chasing is indeed reversing as apparent so far, both the metal and its miners’ stocks still have long ways to fall before this drawdown runs its course. Both extreme sentiment and technicals need to be rebalanced.
Successful trading demands always staying informed on markets, to understand opportunities as they arise. We can help! For decades we’ve published popular weekly and monthly newsletters focused on contrarian speculation and investment. They draw on my vast experience, knowledge, wisdom, and ongoing research to explain what’s going on in the markets, why, and how to trade them with specific stocks.
Our holistic integrated contrarian approach has proven very successful, and you can reap the benefits for only $10 an issue. We extensively research gold and silver miners to find cheap fundamentally-superior mid-tiers and juniors with outsized upside potential. Sign up for free e-mail notifications when we publish new content. Even better, subscribe today to our acclaimed newsletters and start growing smarter and richer!
The bottom line is American stock investors’ gold chasing via gold ETFs is reversing. Since gold peaked, major-gold-ETF bullion holdings have relentlessly fallen. This is unusual, as they’ve normally lagged major gold reversals historically. Gold plummeting out of its latest record close contributed to the urgency to exit, seriously damaging bullish psychology. This young exodus from gold ETFs could easily snowball.
So far investors have merely unwound about 1/5th of the holdings build from their frenzied differential gold-ETF-share buying in September and the first few weeks of October. If they keep selling, that will force the gold ETFs to dump more physical bullion intensifying gold’s necessary drawdown. That in turn will ramp pressure on investors to flee gold ETFs, which could spawn a vicious cycle of selling pounding gold much lower.
Adam Hamilton, CPA
October 31, 2025
Copyright 2000 – 2025 Zeal LLC (www.ZealLLC.com)
Read the full article here


Leave a Reply