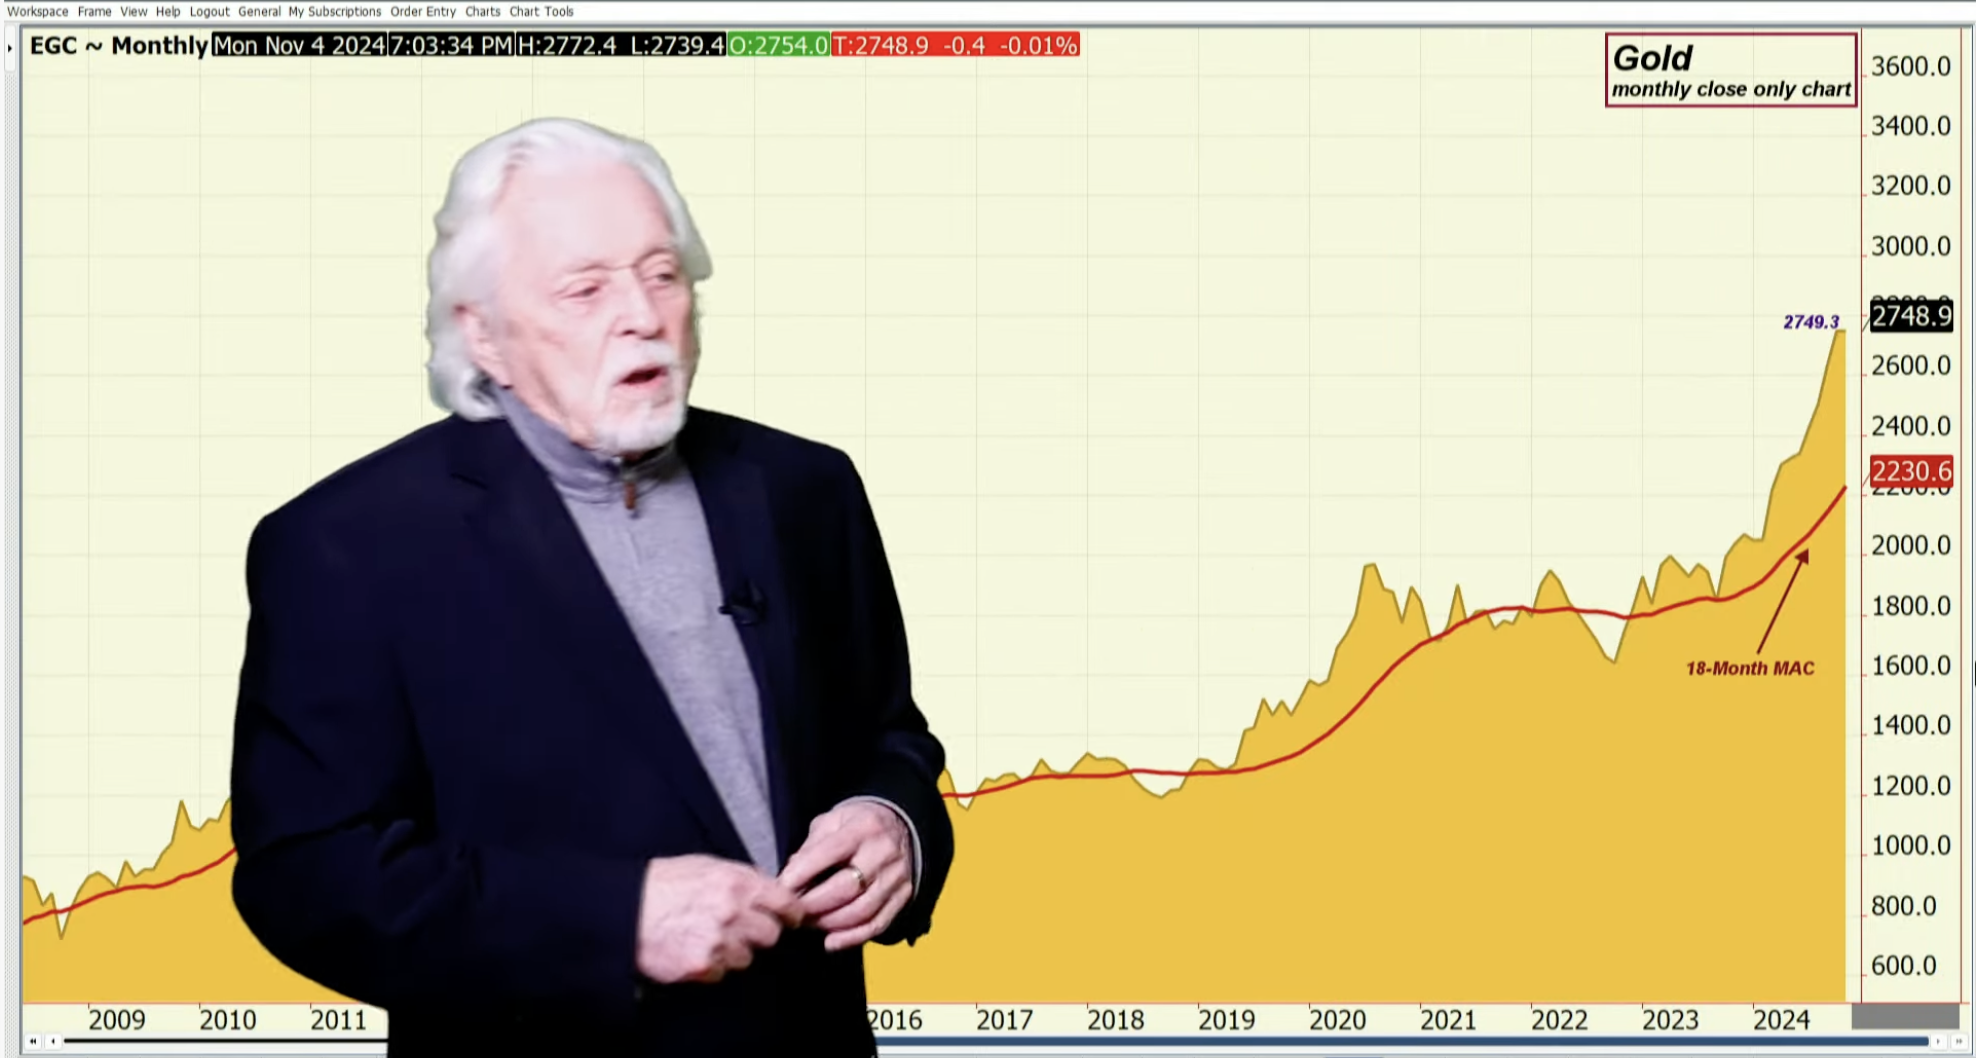
When you look at gold now, on a monthly close-only chart, because this month’s going. Well, if it finished here, it’d be at $2749.30, okay. When you look at gold on its peak when it was up there, on a settlement basis – just a settlement. Or you look at where it was, you can see how high it got up there. When we come back to gold and you look at a weekly chart, and by the way, it didn’t settle. And I want to make that clear. I wrote that the peak was $2801.80; that was not the high settlement so I don’t want you to get confused. You’ll see that right here is the market on this week, which is last week, got up to $2801.80 and finished to $2749.40.
Higher lows, higher highs. You know, if you break down the bigger support on a weekly basis, is $2565.60, I am not saying it’s going there, but that’s where the big support is. The resistance has been the upper Bollinger Band. And what’s been the one constant all the way through? the bullish embedded reading.
Read the full article here

