

The Captain’s Bitcoin chart.
Analysis:
Bitcoin was lower again this past week, reaching a low of 65,084, closing at 69,358.
We are now working on the assumption that since its inception, Bitcoin has now completed a five-wave impulsive rally at the 126,287 high, to complete wave 1. We are now falling in wave 2, which has a retracement zone of:
50% = 63,144.
61.8% = 48,242.
Within wave 2, we likely completed wave -a- at 60,070, and if that is the case, we are now moving higher in wave -b-, which has the following retracement levels:
50% = 93,179.
61.8% = 100,992.
After wave -b- ends, we expect another drop in wave -c- back to at least the wave -a- low to complete all of wave 2.
Active Positions: Flat!
SP500:
 The Captain’s 120-minute SP500 chart.
Analysis:
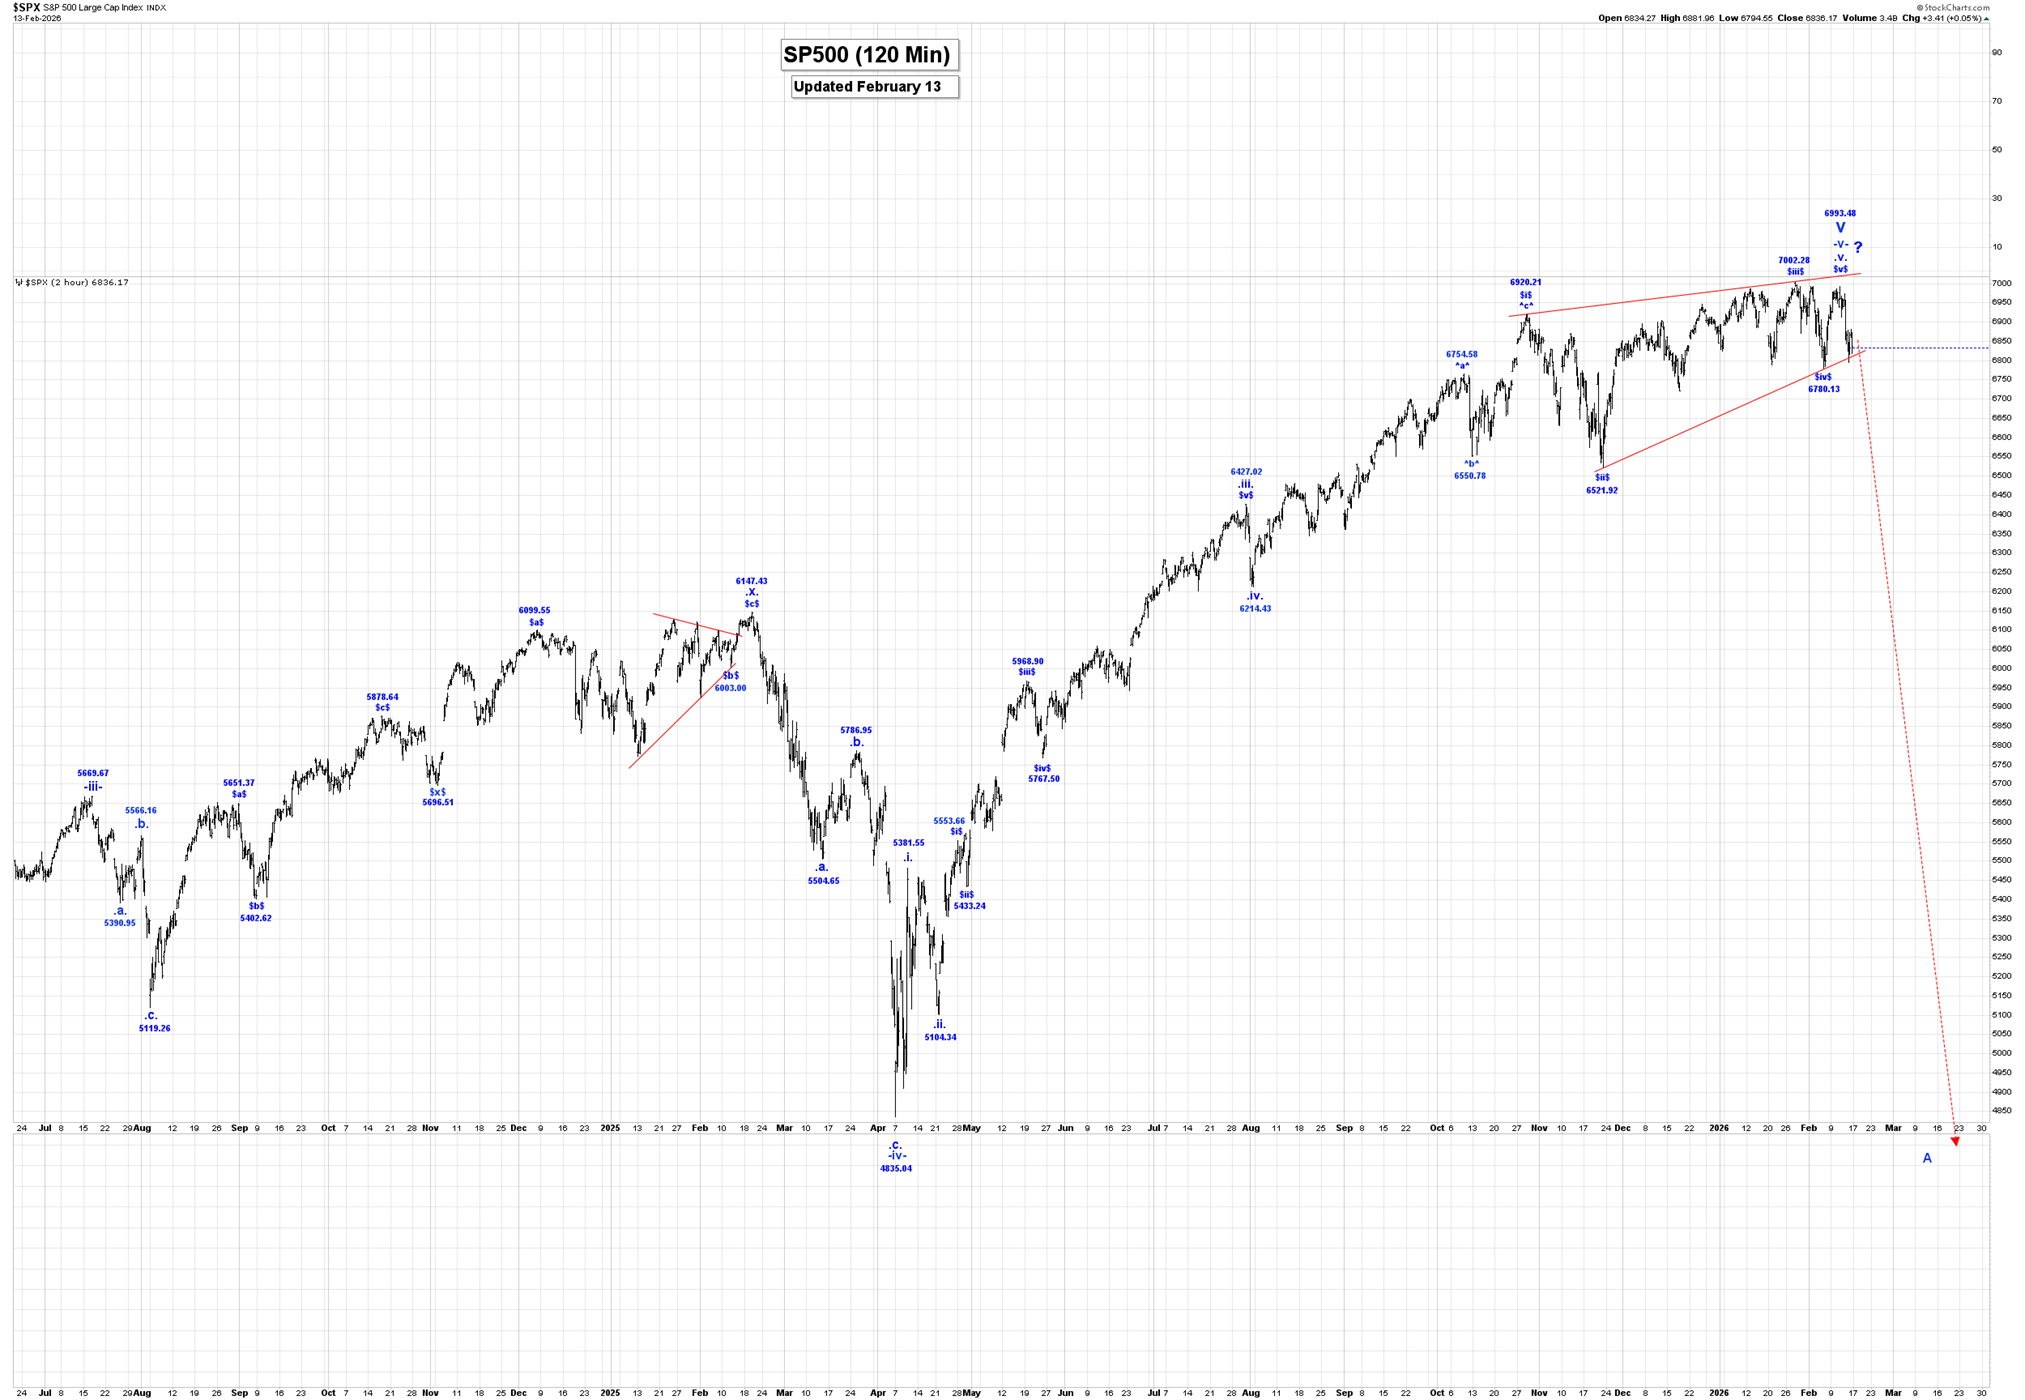
The SP500 initially rose this past week, reaching a high of
6993.48, although after that high was made, we moved lower, reaching a low of 6794.55, closing at 6836.17.
Within v of V, wave (iv) ended at 4835.04, and we are moving higher in wave (v), which has the following updated internal wave count:
.i. = 5381.55.
.ii. = 5104.34.
.iii. = 6427.02.
.iv. = 6214.43.
.v. = 6993.48, if complete.
We are waiting for confirmation that our wave $v$ of .v. ending diagonal triangle formation is complete at the 6999.48 high, as opposed to expanding and extending further before it ends.
Active Positions: Flat!
Gold:
 The Captain’s weekly gold chart.
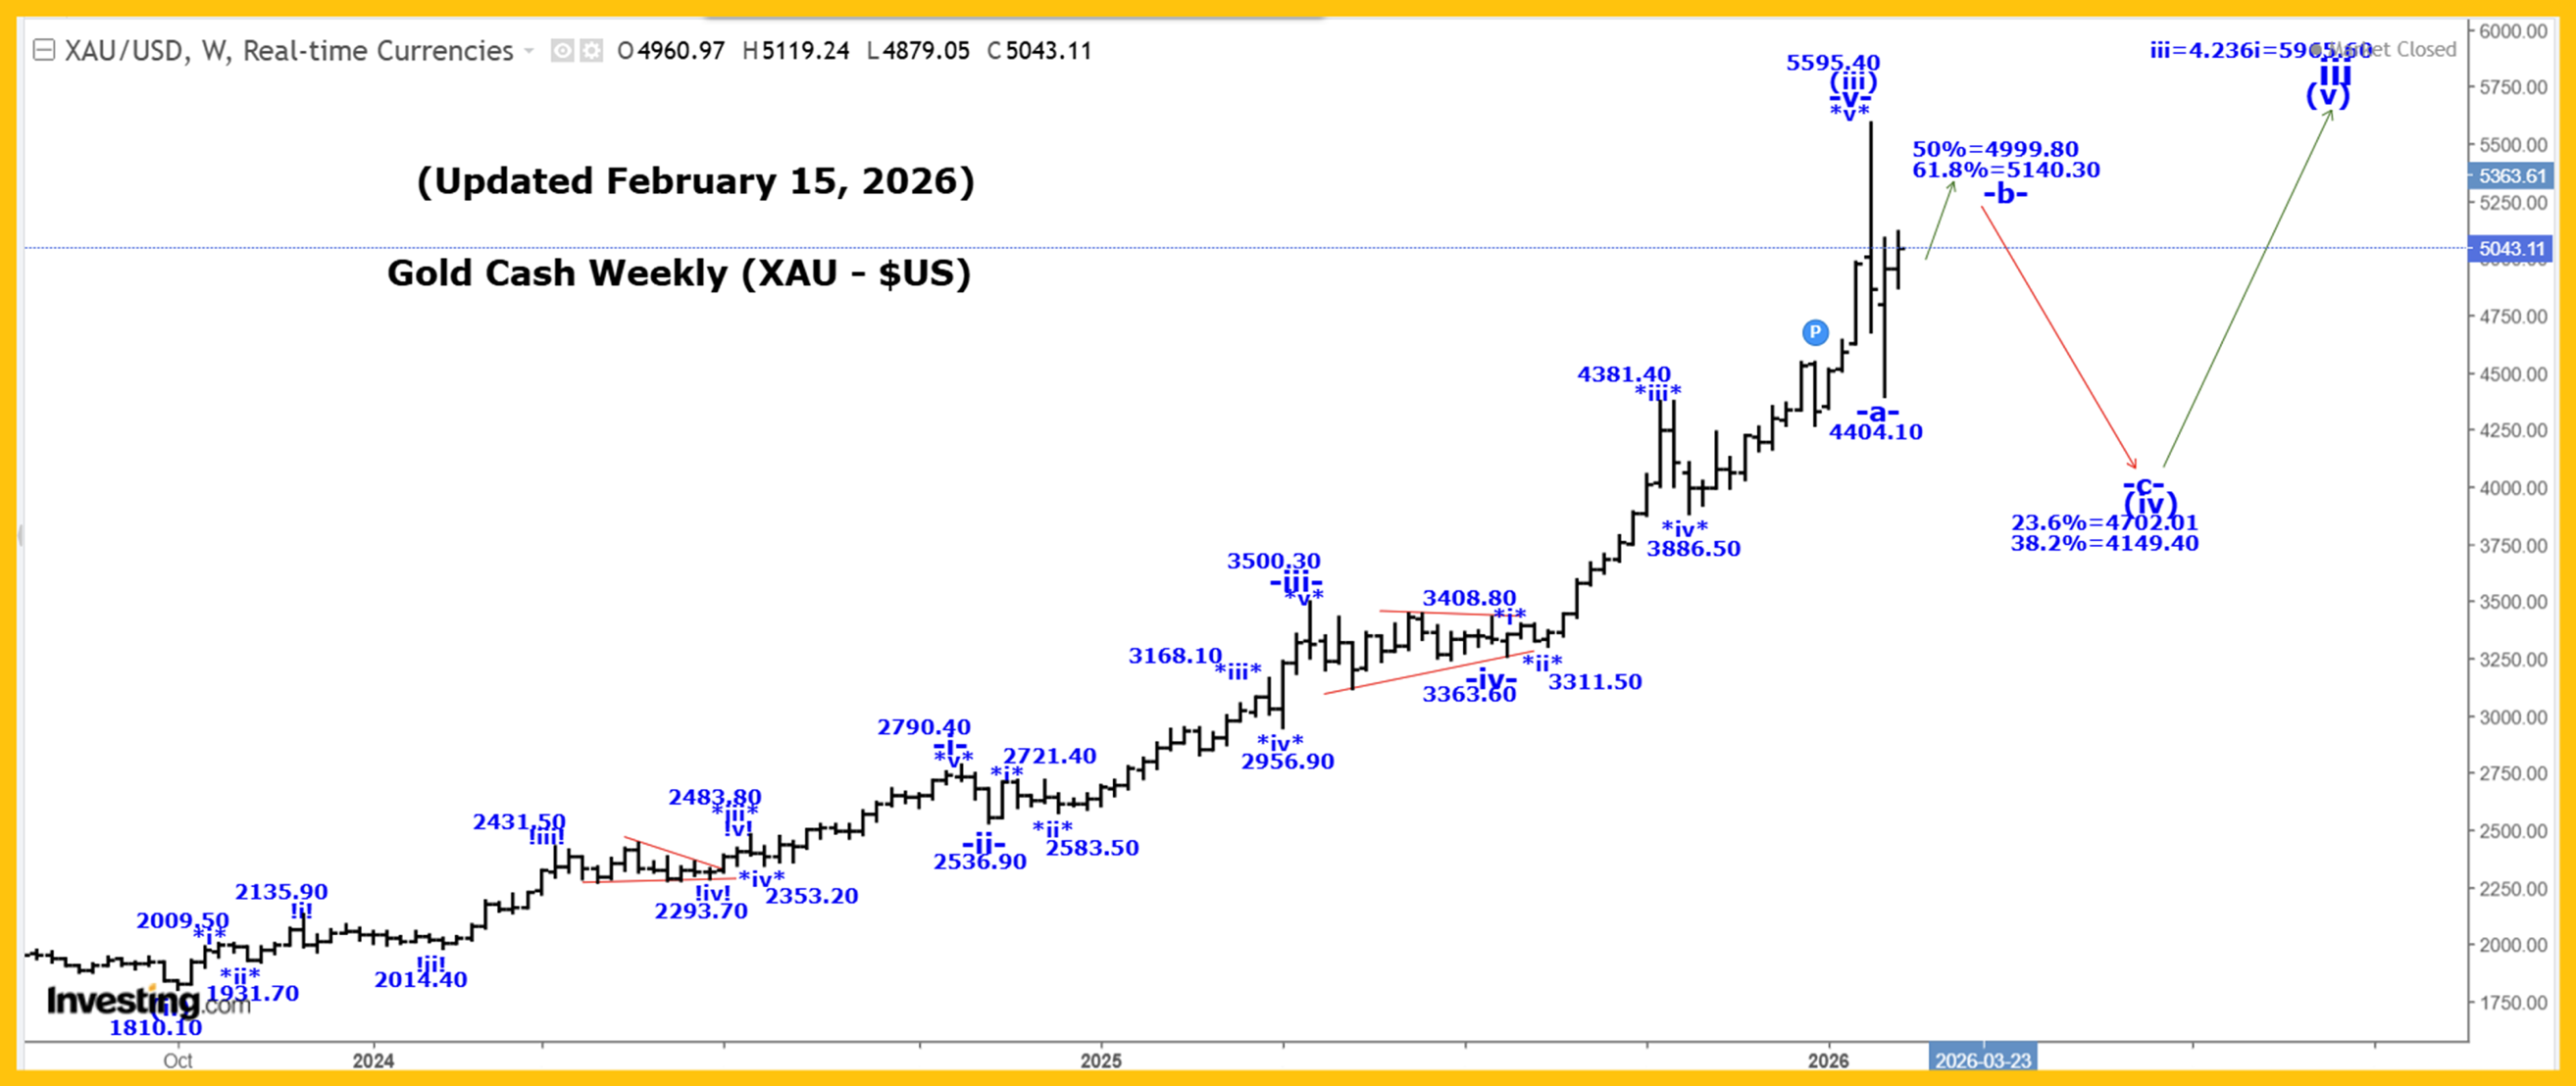
Gold was higher again this past week, reaching a high of 5119.20, closing at 5043.10.
Our current long-term gold count, starting from the 35.20 low made back in 1971:
1 = 1920.80.
2 = 1046.20.
3:
i = 2073.40.
ii = 1614.40.
iii:
(i) = 2073.30.
(ii) = 1810.10.
(iii):
-i- = 2790.40.
-ii- = 2539.90.
-iii- = 3500.30.
-iv- triangle = 3363.60.
-v- = 5595.40, to complete all of wave (iii).
(iv):
-a- = 4404.10.
-b- rally is still underway.
-c- drop after wave -b- ends to complete all of wave (iv).
A very powerful wave (iii) of iii is now complete at the 5595.40 high, and we are now falling in a multi-month wave (iv), a correction that has the following retracement levels:
23.6% = 4702.00
38.2% = 4149.40.
Within wave (iv), we likely completed a five-wave drop to complete all of wave -a- at 4404.10 low, and if that is the case, then we are now moving higher in wave -b-, which has the following retracement levels:
50% = 4999.80.
61.8% = 5140.30.
We have now entered our retracement zone, but we doubt that all of wave -b- is already complete. After wave -c- ends, we expect another drop in wave -c- to complete all of wave (iv).
Wave (iv) could also become much more complex than we are currently suggesting, as we do expect very high volatility within wave (iv) as it develops over the next 3 to 6 months and perhaps for the rest of 2026.
Projections for the end of wave 3 are:
3 = 2.618(1) = 5936.00.
3 = 4.236(1) = 9033.60!
Active Positions: Flat!
Thank-you!
Captain Ewave & Crew
Read the full article here