


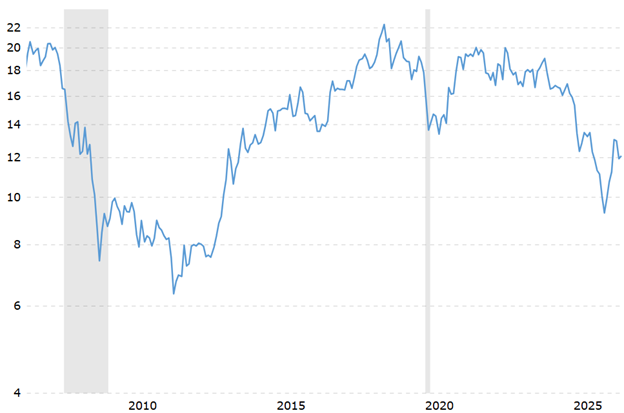
 Ratio of the Dow Jones Industrial Average to the price of gold
The Dow-to-Gold ratio measures how many ounces of gold it takes to buy one “share” of the Dow Jones Industrial Average.
In 2011 it took 6 ounces of gold to buy the Dow.
It now takes 12 ounces of gold to buy the Dow.
Because the ratio doubled, the Dow became twice as valuable relative to gold. This means the Dow significantly outperformed gold over this time period.
In 2011, both the stock market and gold experienced major milestones, but the Dow Jones Industrial Average has significantly outpaced gold since then.
During the peak of the 2011 commodities boom (around August/September 2011), the Dow Jones was trading around 11,500 while gold hit a then-historic high of roughly $1,900 per ounce, briefly bringing the ratio down close to 6.
Price Comparison: 2011 vs. Today
|
Asset |
Late Summer 2011 Price |
Price Today (Sept 24, 2026) |
Absolute Return |
|
|
|
|
|
|
Dow Jones (DJIA) |
~11,500 |
~51,371 |
+346% |
|
Gold (Per Ounce) |
~$1,900 |
~$4,257 |
+124% |
Contextual Breakdown
|
Era / Extreme Event |
Ratio Level |
Market Environment |
|
1929 Stock Peak |
~19.0 |
Extreme speculation before the crash |
|
1933 Great Depression Low |
~1.9 |
Deflationary stock collapse; banking crisis |
|
1966 Post-War Peak |
~28.0 |
Post-war economic boom; gold pegged at $35 |
|
1980 Stagflation Low |
~1.0 |
Runaway inflation; gold buying frenzy |
|
1999 Dot-Com Peak |
~44.0 |
Internet tech bubble; gold deeply ignored |
|
2011 Precious Metals Peak |
~6.0 |
Post-2008 debt fears; commodities boom |
|
Today (Sept 2026) |
~12.0 |
Moderate territory; below the 50-year post-1971 average (~15) |
The long-term historical average sits right around 15. Because the ratio currently reads at 12, today’s markets aren’t sitting at either historic extreme—meaning the valuation gap between stocks and hard money is balanced far more normally than it was during the tech bubble of 1999 or the crisis periods of 1980 and 2011.
During major market shocks, the Dow-to-Gold ratio typically undergoes a two-phase process: a sudden initial collapse followed by a multi-year trend dictated by how much money central banks print.
In a severe crisis, the ratio always drops because stocks plunge while gold serves as a safe haven. However, the speed of the recovery makes a massive difference in how long the ratio stays depressed.
Here is exactly how the ratio behaved during the two most prominent modern shocks:
The 2008 Global Financial Crisis (A Long-Term Ratio Crush)
The 2008 crisis triggered a sustained, multi-year destruction of the Dow-to-Gold ratio because the economic damage was deep and structural, requiring years of monetary stimulus.
In October 2007, the ratio sat around 18.5. As the housing market cracked and Lehman Brothers collapsed, the Dow lost over 50% of its value. Gold briefly sold off during the absolute worst of the March 2008 liquidity panic as investors sold everything to raise cash, but it rebounded rapidly. By the end of 2008, the ratio plummeted to roughly 10.
Even though stocks began to recover in 2009, the Federal Reserve initiated aggressive Quantitative Easing (QE) (printing money). Fear of fiat currency debasement caused gold to rocket from $700 to $1,900. Gold outpaced stocks so aggressively that the ratio kept sinking, eventually bottoming out at ~6.0 in late summer 2011.
The 2020 COVID-19 Pandemic (The “V-Shaped” Flash Crash)
The 2020 pandemic was a fast-forward version of 2008. The ratio crashed instantly, but central banks flooded the system with money so quickly that equities recovered at lightning speed, preventing a long-term ratio depression.
Going into 2020, the ratio was strong at ~18.5. When global lockdowns hit in March, the Dow suffered historic point drops. Just like in 2008, there was a frantic 2-week period where gold prices temporarily dipped because institutional investors liquidated gold to cover stock market losses. Even with gold’s brief dip, the Dow fell so much faster that the ratio violently dropped from 18.5 down to ~13.5 in a matter of weeks.
The Federal Reserve pumped trillions into the economy almost overnight. Gold responded first, screaming to a then-record high of $2,021 by August 2020, pushing the ratio to its pandemic low of 13.2. However, because interest rates were zero and tech companies boomed from the work-from-home era, the Dow staged an unprecedented recovery. By 2021, the Dow’s rapid rise pushed the ratio right back up to ~19.5, completely erasing the pandemic drop.
Direct Comparison: 2008 vs. 2020 Shocks
|
Crisis |
Starting Ratio |
Peak Panic Ratio |
2 Years Post-Crisis |
Ratio Behavior |
|
2008 Financial Crisis |
~18.5 |
~10.0 |
~7.5 (Kept Falling) |
Structural Drag: Equities took years to recover while money printing fueled a massive 3-year gold bull market. |
|
2020 COVID Pandemic |
~18.5 |
~13.5 |
~19.5 (Fully Recovered) |
Flash Shock: Sudden crash, but hyper-speed federal stimulus triggered an instant V-shaped stock market rebound. |
During the absolute peak of a market panic, the Dow-to-Gold ratio almost always drops because gold holds its ground or rises while corporate valuations evaporate.
If the crisis turns into a prolonged, grinding economic recession (like 2008), the ratio will stay low or keep dropping as gold wins the multi-year cycle. If the crisis is met with an immediate, overwhelming monetary rescue that sparks an organic business rebound (like 2020), the ratio will snap back up quickly as paper assets reclaim dominance.
2008 versus 2020
Today’s conditions are structurally closer to the macro dynamics of 2008 than the brief shock of 2020, but with a critical, modern twist: instead of fighting a deflationary crash, markets are dealing with persistent inflation.
While the exact Dow-to-Gold ratio of ~12 feels balanced, the underlying forces moving both assets mirror the prolonged, systemic pressures of the post-2008 era.
In 2020, the Federal Reserve instantly cut interest rates to zero and flooded the system with cash, launching an immediate V-shaped bounce. Today, the Fed under Chair Kevin Warsh is doing the exact opposite—unanimously raising interest rates (up to the 3.75%–4.00% range) to combat hot, multi-year inflation. This grinding, tighter monetary policy feels much more like the restrictive environments that precede long economic cycles.
Much like the oil shocks and structural commodity booms that drove gold up and squeezed corporate earnings between 2007 and 2011, today’s market is digesting persistent energy-price shocks stemming from conflicts like the war involving Iran.
In 2020, gold spiked briefly on fear and then stagnated as tech stocks took over. Today, we are seeing massive, structural sovereign demand—led heavily by historic buying from central banks like China—fueling a powerful multi-year bull market that has driven gold over $4,200 an ounce. This is a long-term shift toward hard assets, highly reminiscent of the 2008–2011 cycle.
The major divergence from both 2008 and 2020 is that the stock market has remained incredibly resilient.
In 2008 and 2020, the ratio fell because equities collapsed. Today, the ratio is sitting at 12 because both gold and stocks are rising together. Corporate productivity and earnings have held up surprisingly well, meaning paper wealth and hard assets are currently in a fierce tug-of-war.
Historically, whenever the Dow-to-Gold ratio tests or breaks below the 12.0 level, it signals that the cycle is turning toward hard assets. Because the current market lacks the emergency central bank safety net of 2020, any sudden crack in economic growth could cause the Dow to pull back while gold continues its march upward—potentially pushing the ratio down toward 2011 levels.
Forecasts
Goldman Sachs has a highly constructive outlook moving into 2027, but their forecasts reveal a clear divergence: they expect gold to experience an aggressive, structural breakout while the broad stock market undergoes a steady, earnings-driven grind higher.
Goldman emphasizes that Federal Reserve rate hikes will only slow down—not derail—the gold rush. The primary catalyst is massive, unrelenting structural accumulation by global central banks (such as China), which are aggressively diversifying away from fiat currency reserves. Furthermore, high demand for gold derivatives as a geopolitical hedge adds massive upward convexity to their price model.
If Goldman Sachs’ forecasts hit their exact marks by the end of 2027:
The Dow would experience a moderate, healthy rise of roughly 6% to 8% off today’s levels and gold would surge by over 23% to hit $5,400.
Other major Wall Street firms generally align with Goldman Sachs’ core outlook: they expect gold to continue its secular bull run, while equities push higher on robust corporate earnings.
However, several prominent banks are significantly more aggressive than Goldman Sachs on how high gold can climb, while presenting varying views on the stock market.
J.P. Morgan Global Research is one of the most bullish on the Street. Head of Commodities Strategy Natasha Kaneva notes that despite any short-term, rate-driven volatility, they see a clear path toward $6,300 per ounce by 2027. Their thesis relies on unstoppable global central bank diversification entirely away from the U.S. dollar.
Bank of America aligns with the highly bullish camp, identifying a structural “flight to hard safety”. They project gold firmly testing the $5,000 to $6,000 range, citing rising global sovereign debt loads that make fiat currencies less attractive.
Morgan Stanley targets a path exceeding $5,000 in 2027. Analyst Amy Gower highlights that even with a hawkish Federal Reserve, a sudden revival in Western retail gold ETF demand is beginning to layer on top of existing central bank buying.
When you aggregate Wall Street’s consensus, the implied Dow-to-Gold ratio for 2027 points even lower—moving toward 9.0 to 10.0.
While the stock market is expected to remain highly profitable and resilient, the sheer velocity of gold’s repricing across almost every major banking desk implies that institutional money is heavily emphasizing macro insurance via hard assets right now.
Silver
Wall Street institutions are noticeably more cautious about silver moving into 2027 than they are about gold. While gold is enjoying an aggressive structural floor built on central bank accumulation, silver is facing distinct macro headwinds that have led several major banking desks to cut their price targets.
Analysts widely project that gold will heavily outperform silver through 2027, causing the traditional Gold-to-Silver ratio to widen in gold’s favor.
J.P. Morgan Global Research recently slashed its 2027 forecast by 26% (down from an original high estimate of $85.80). They see silver averaging roughly $63.90 through 2027, citing an easing of physical supply tightness and a drop-off in retail investor demand.
While BofA notes that silver could see brief, speculative flash-spikes up to $100/oz if gold screams higher, they warn that the momentum will not last. They expect silver to stabilize and trade around $75.00 mid-year.
HSBC raised its baseline target slightly but explicitly warned of limited long-term upside. They project an average of $68.00 for the year, expecting prices to gradually soften in the latter half of 2027.
TD expects a gradual normalization, predicting prices will step down toward the $70.00 level by the end of 2027.
The primary engine driving gold’s multi-year bull market is sovereign purchasing by foreign central banks. Central banks do not stack silver for monetary reserves; they almost exclusively accumulate gold. Without this institutional “floor,” silver relies entirely on retail speculation, which has cooled down considerably.
Silver is historically highly sensitive to interest rates. With the Federal Reserve sustaining a restrictive interest rate environment to fight inflation, the opportunity cost of holding non-yielding silver hurts retail investor appetite more acutely than it does gold.
Wall Street is signaling that silver is an industrial asset trying to stabilize during a global manufacturing shift, while gold is acting as a pure sovereign safe-haven. For an investor, this means adding silver right now is a bet on a massive cyclical industrial rebound, whereas gold remains the heavily favored institutional choice for late-cycle macro insurance.
AOTH
aheadoftheherd.com

Read the full article here