

Oil

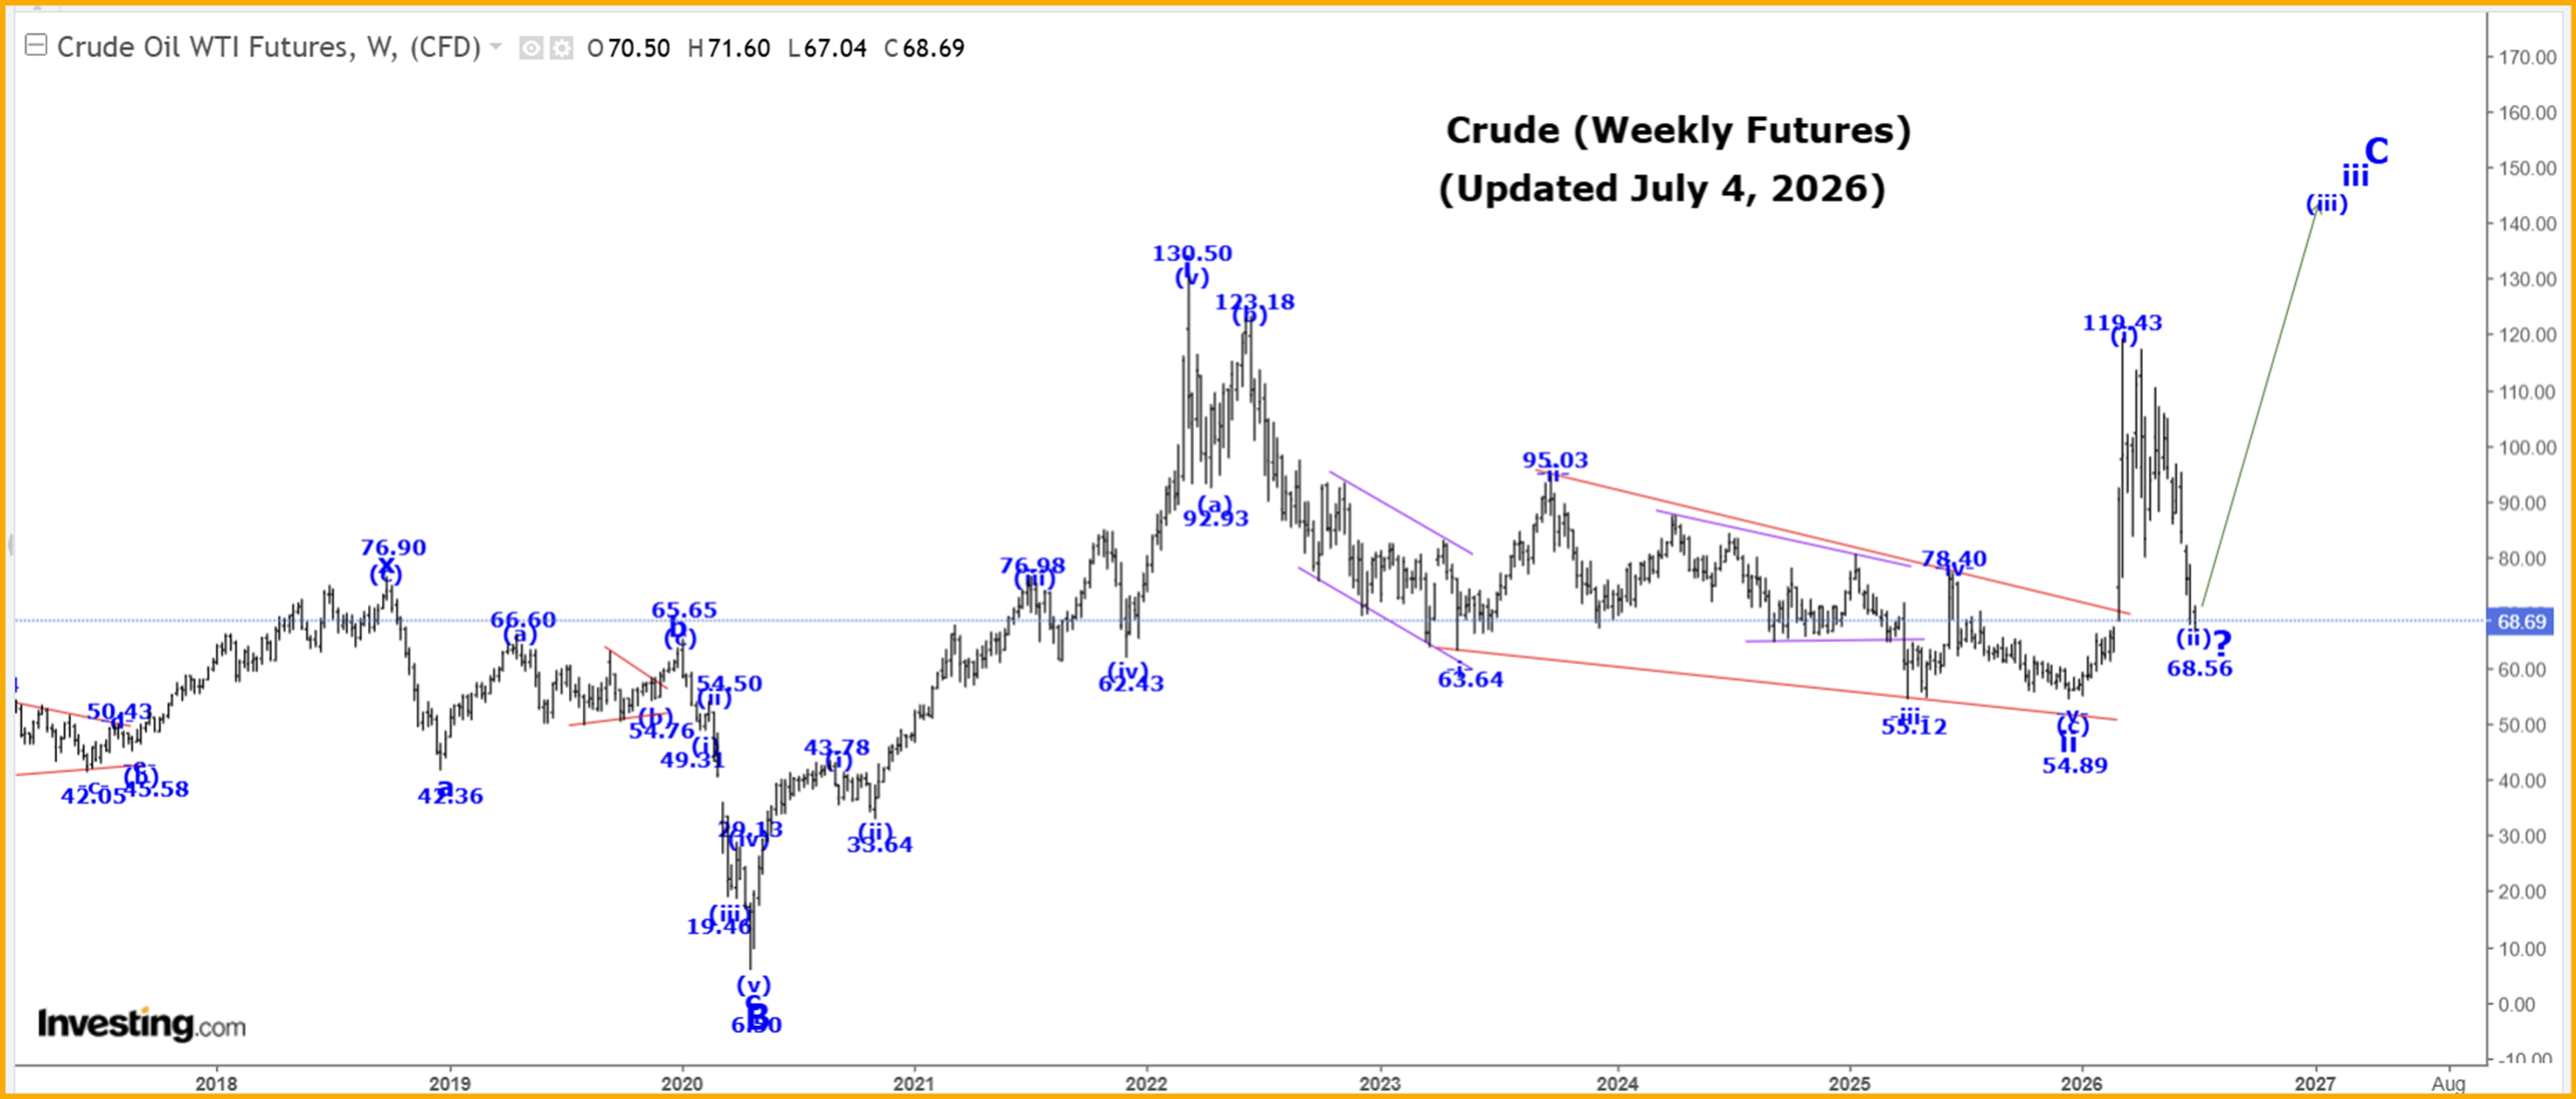
The Captain’s weekly oil price chart.
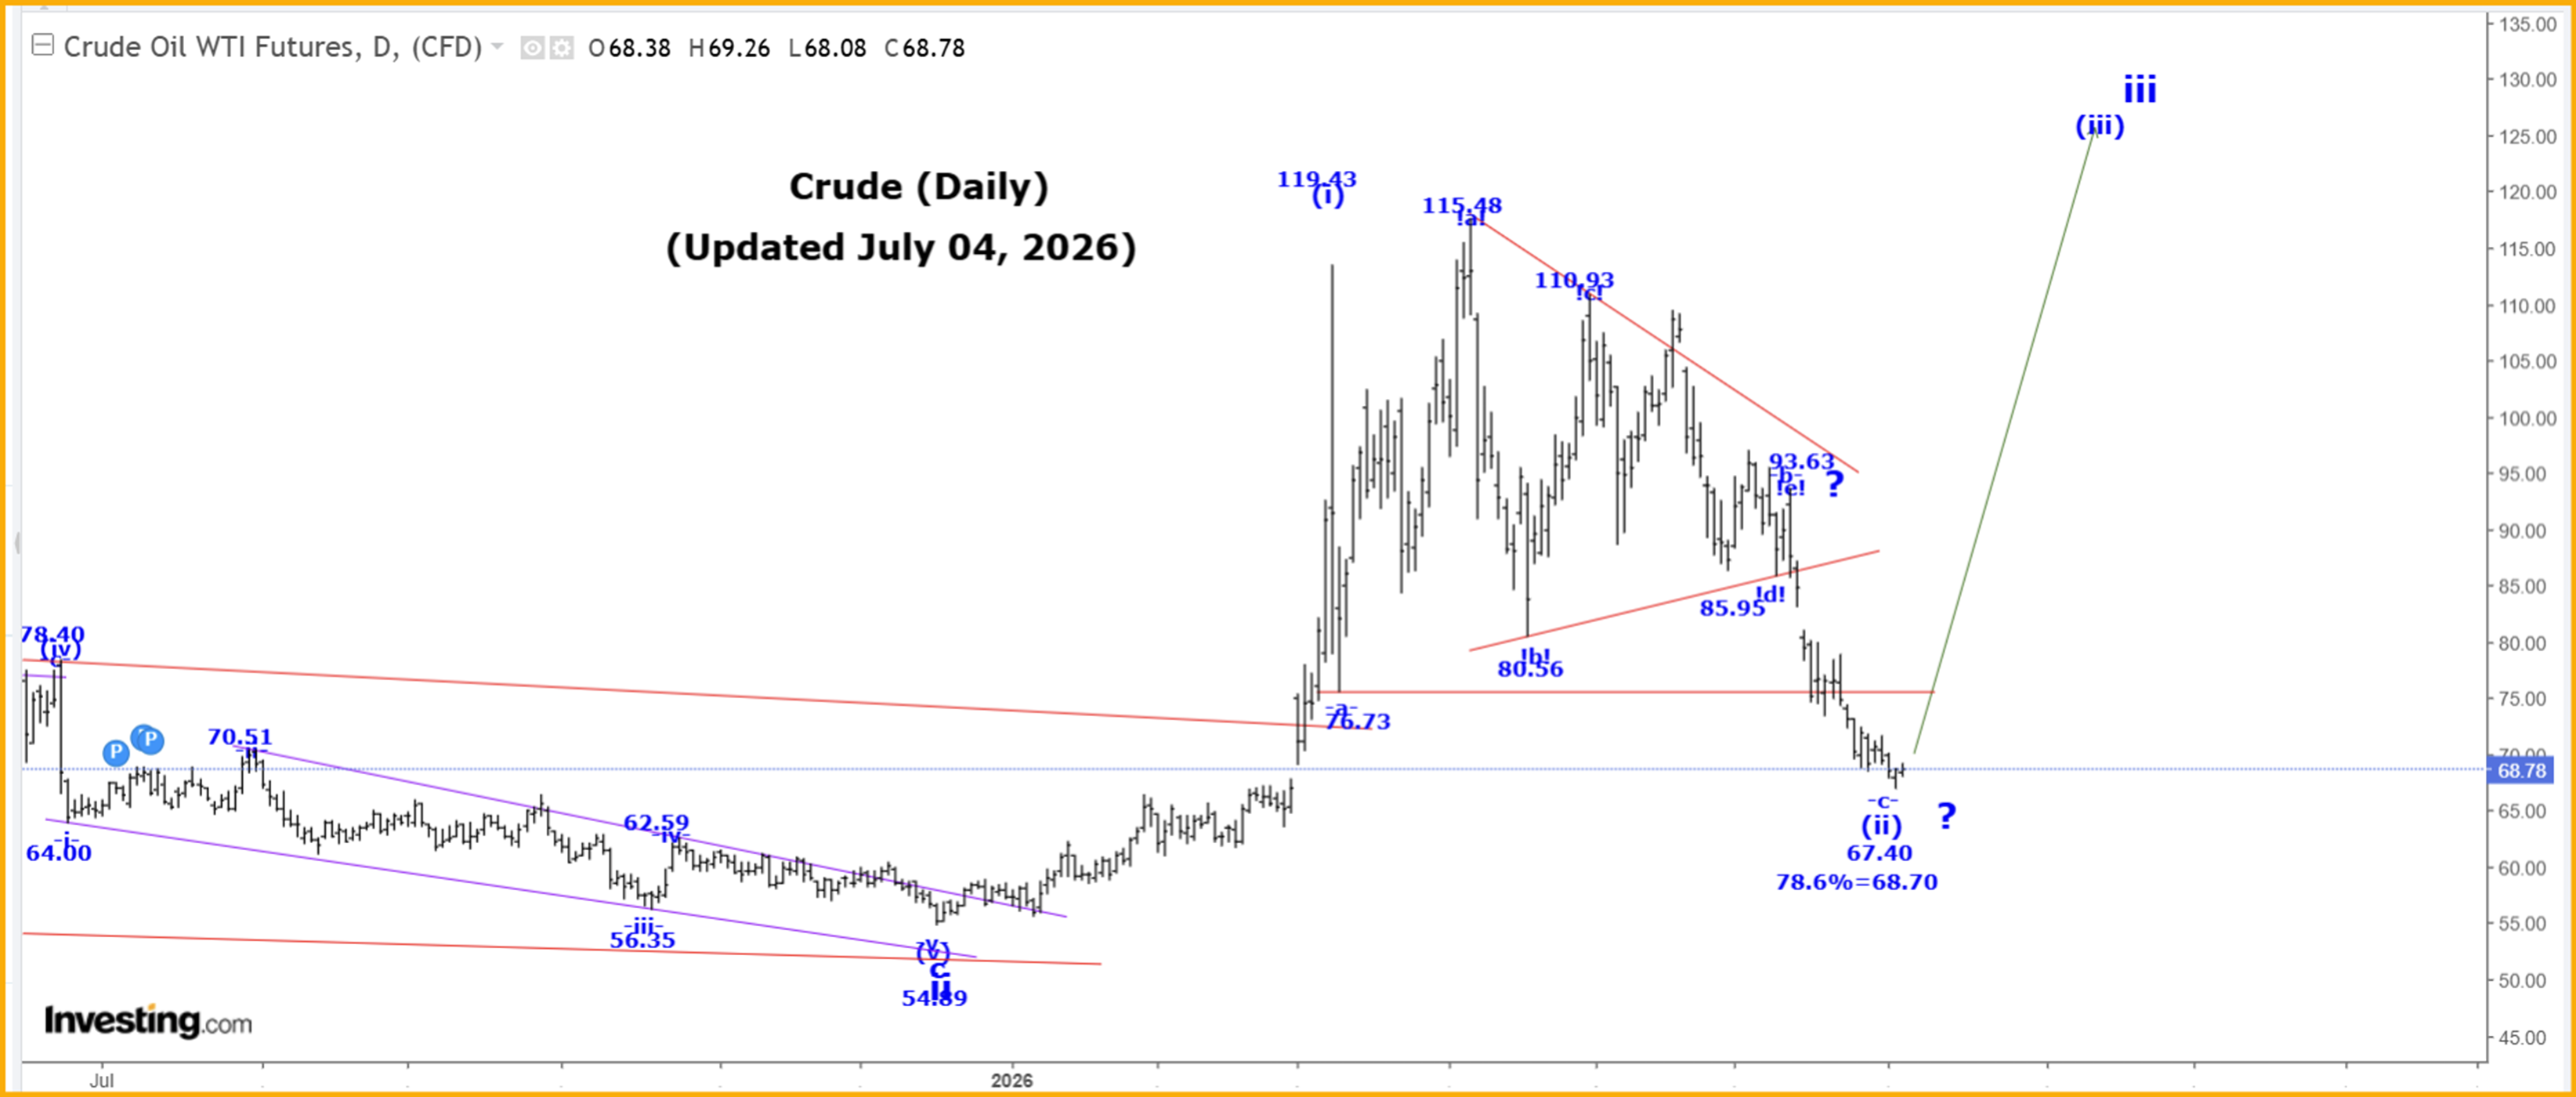
The Captain’s daily oil price chart.
Analysis:
Wave i ended at the 126.42 high and wave ii correction at the 54.89 low.
We are now moving higher in wave iii, and within wave iii, we completed wave (i) at the 119.43 high, and we are now falling in wave (ii), which has a last retracement level of:
78.6% = 68.70.
Within wave (ii), we completed wave -a- of (ii), at 76.73, and our internal wave structure for wave -b- bearish triangle formation is:
We suspect that wave (ii) may be getting very close to completion, perhaps at the 67.25 low.
After wave (ii) ends we expect a very sharp rally higher in wave (iii).
Trading Recommendation: Long crude with a put as a stop. Long Suncor. Long HOU:TSX.
Active Positions: Long crude with puts as a stop! Long Suncor! Long HOU:TSX!
Silver
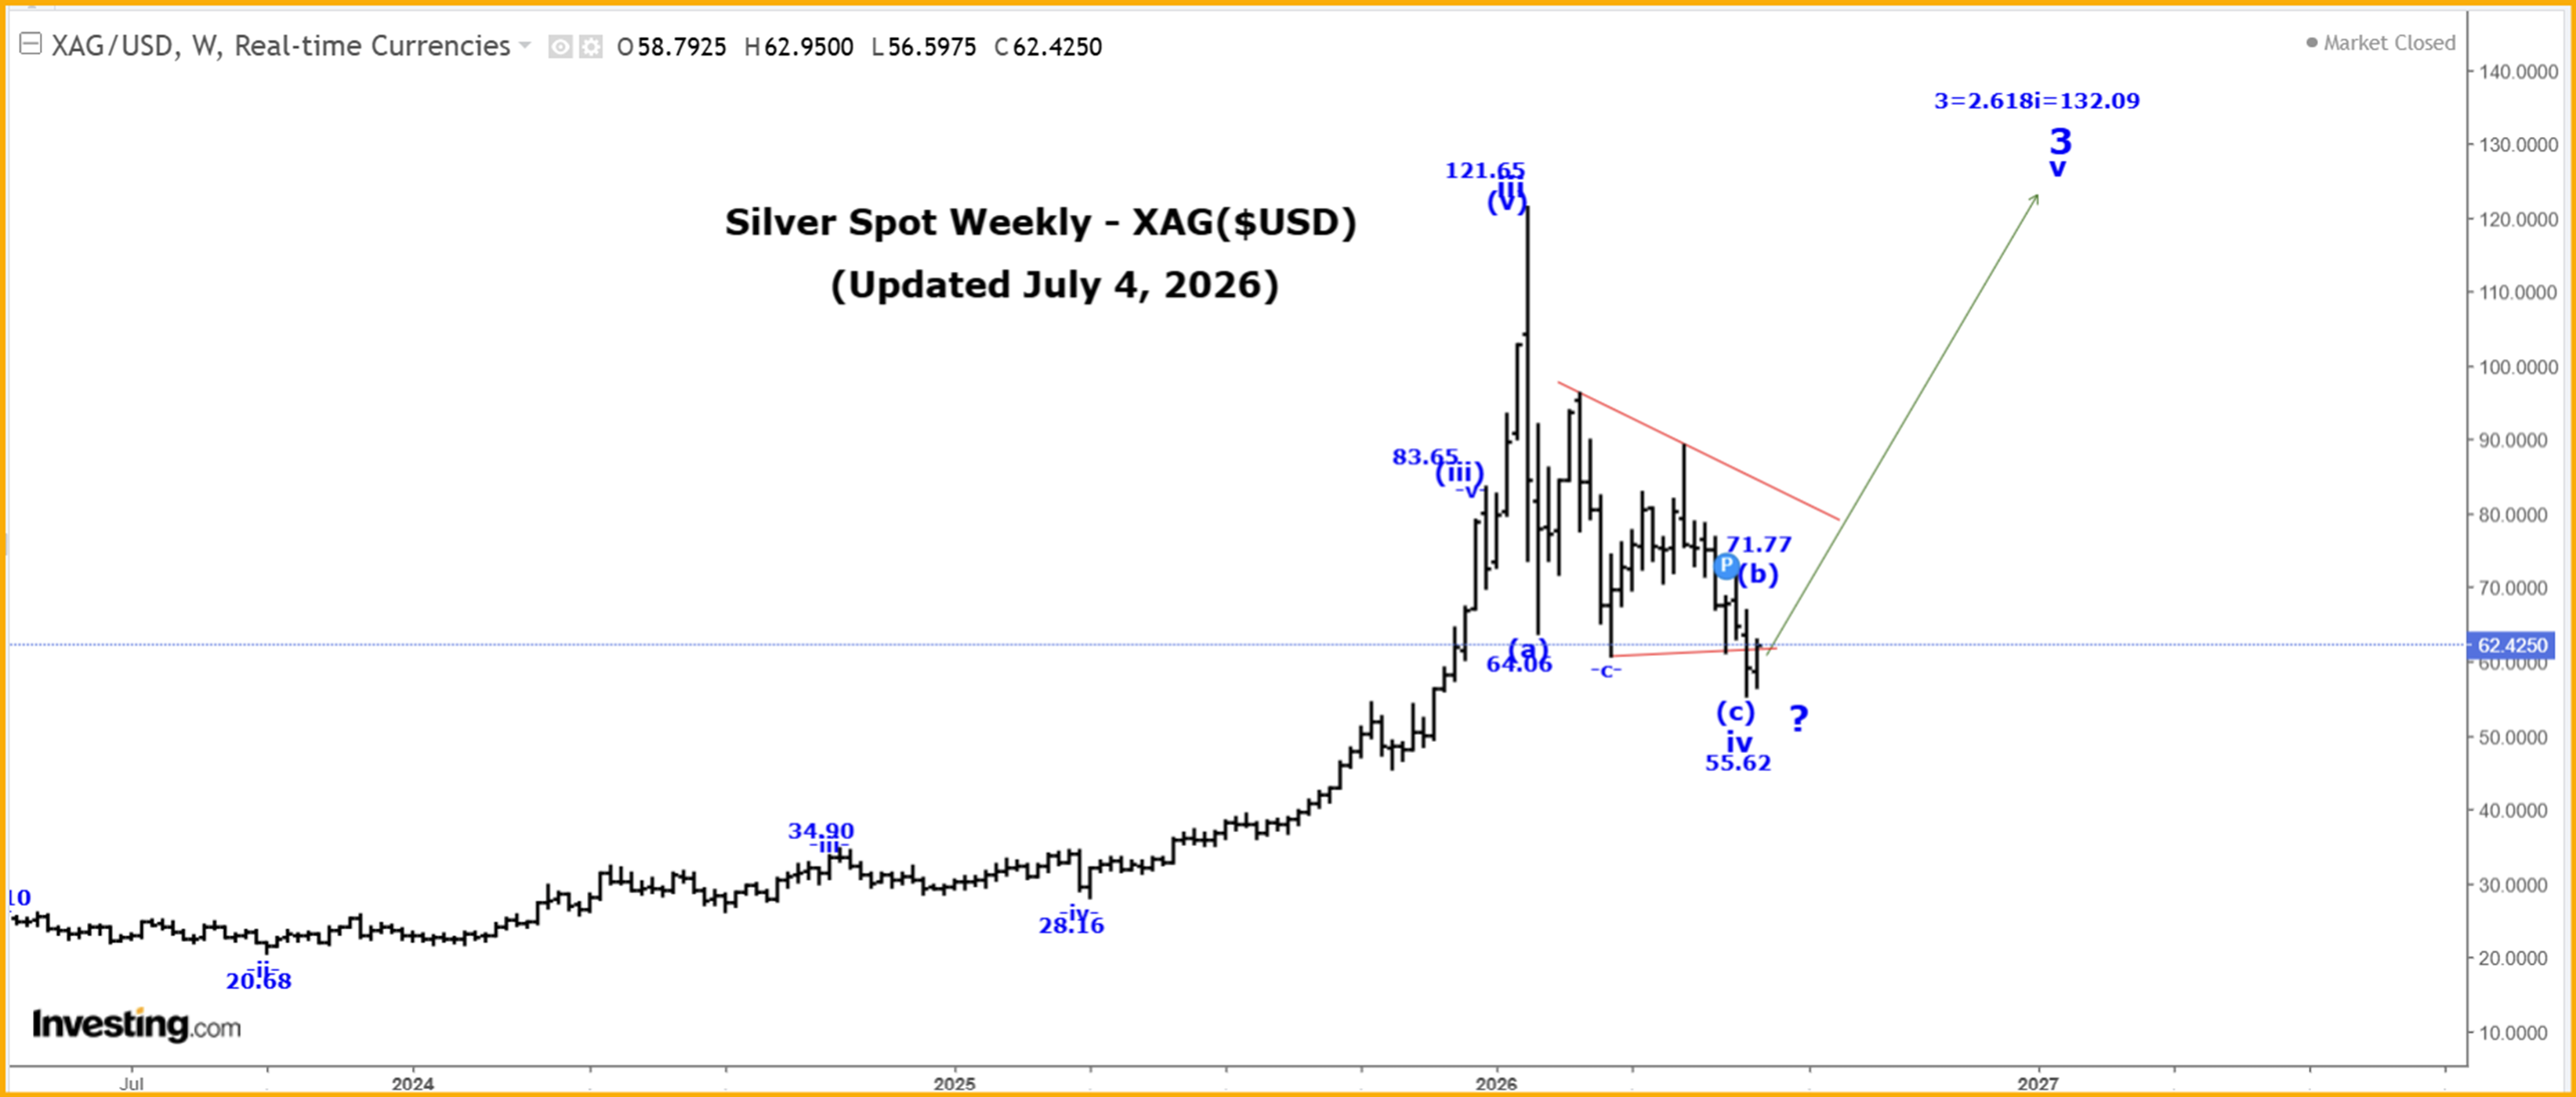
The Captain’s weekly silver price chart.
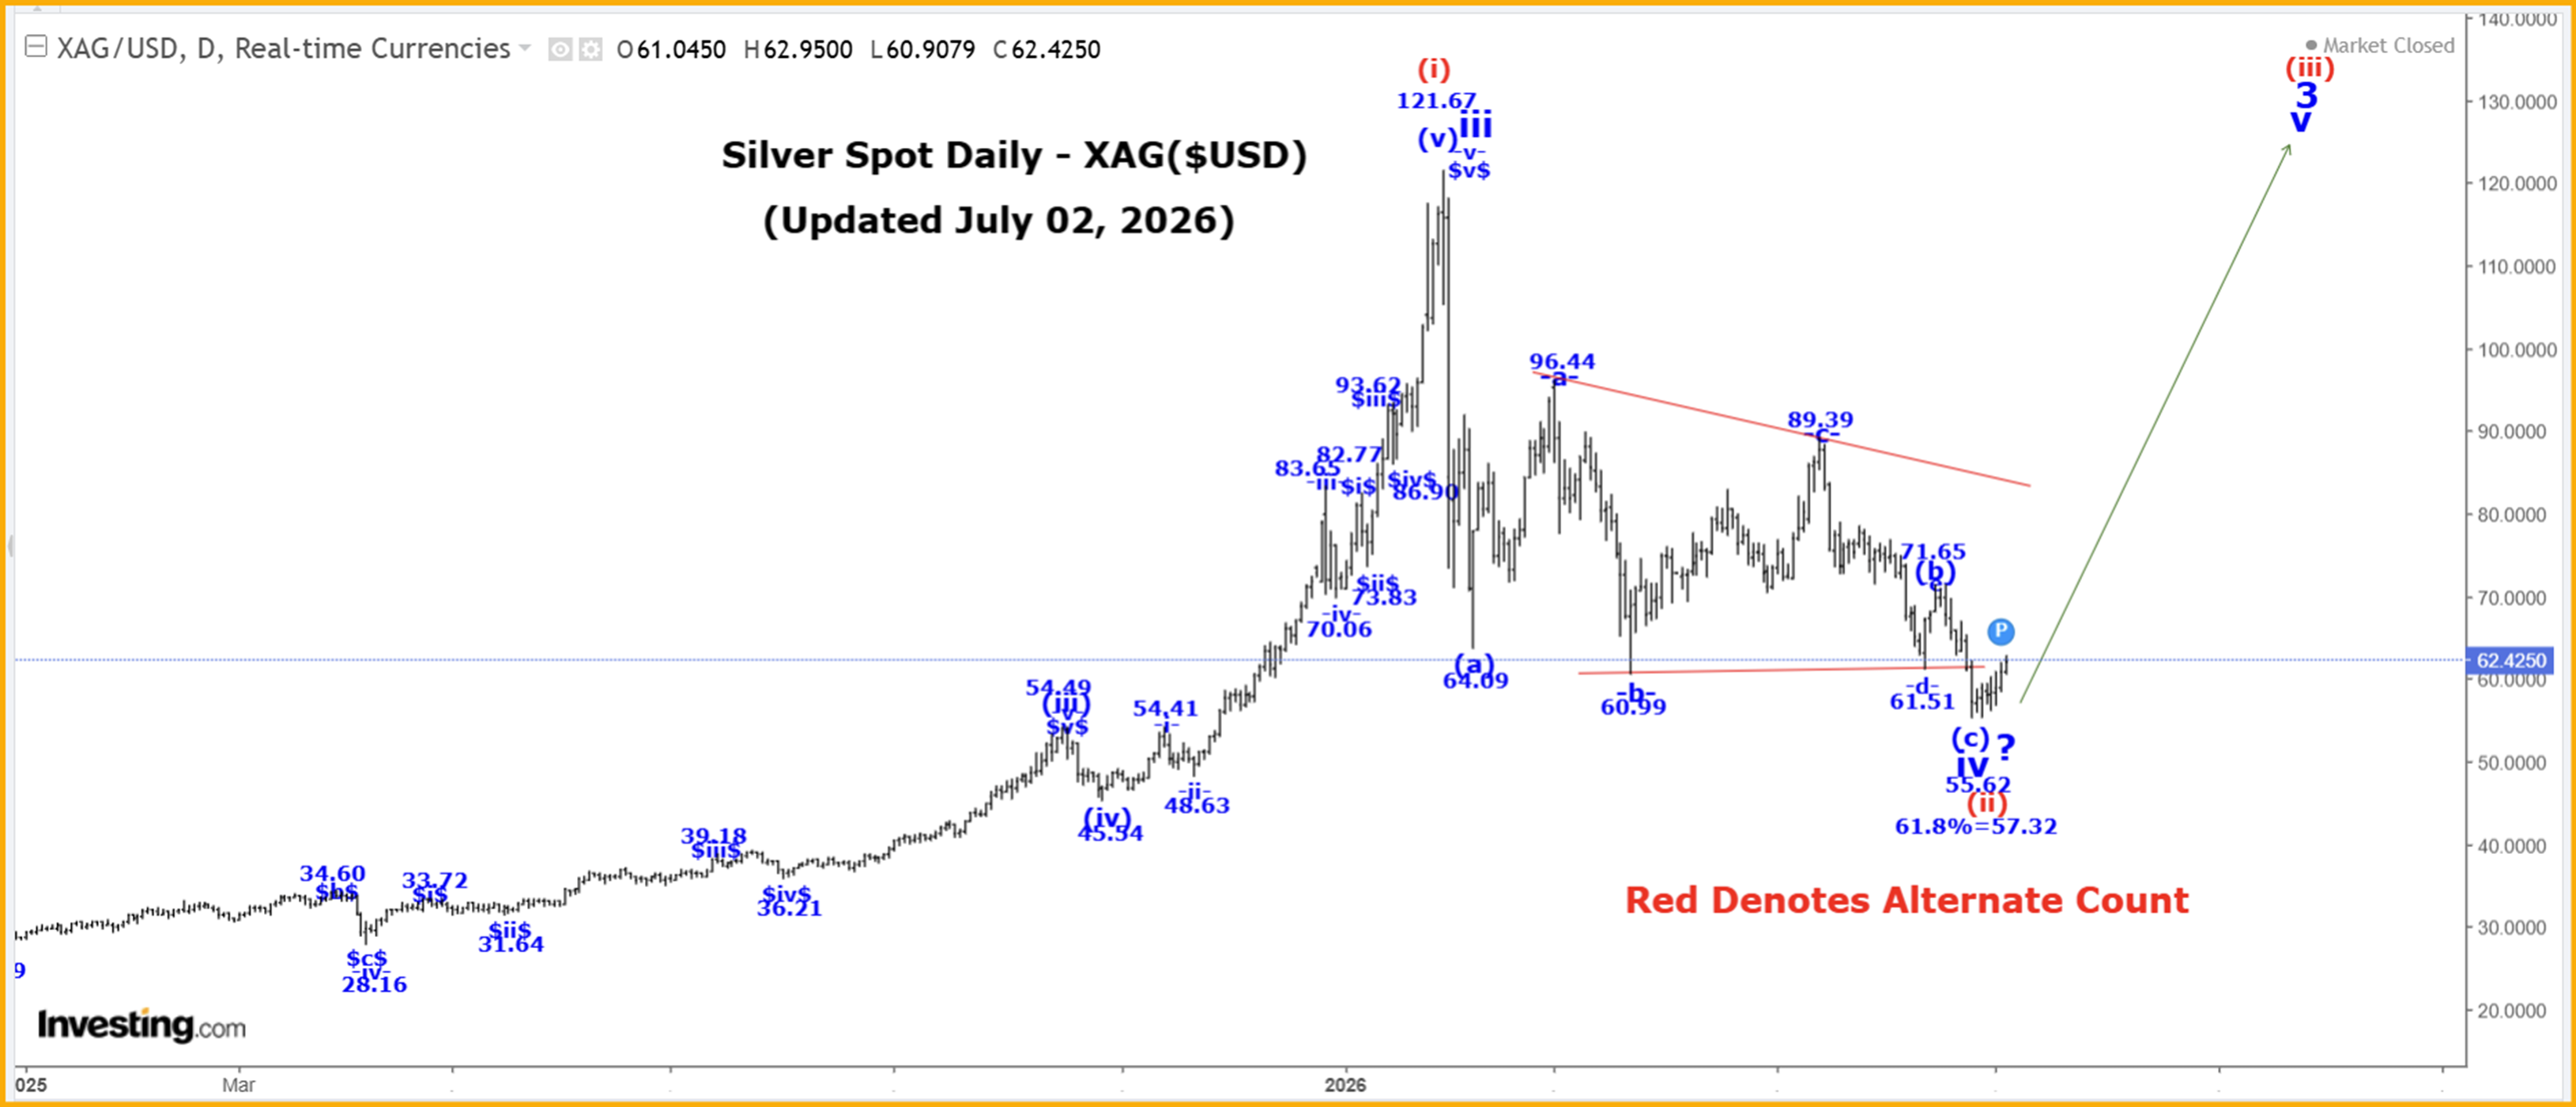
The Captain’s daily silver price chart.
Analysis:
Wave iii ended at the 121.65 high and we are now falling in a multi-month wave iv correction that has the following retracement level:
61.8% = 57.32.
Within wave iv, we cannot rule the possibly that all of wave iv is now complete at the 55.62 low, and that we have started to rally higher in wave v of 3.
The other option is that wave 3 is extending and that only wave i of 3 ended at the 121.56 high and that wave ii likely ended at the 55.62 low.
This would suggest that silver is heading well above the $300 level in wave iii of 3.
In the very long term, we completed all of wave III at 49.00 in 1980 and all of wave IV at 3.55 in 1993. We are now working on wave V and within wave V we have the following count:
1 = 49.56.
2 = 11.64,
3 projection is updated to 3 = 2.618(1) = 132.09!
Active Positions: Long through PSLV:TSX and Silver Futures with Puts as Stops!
Gold
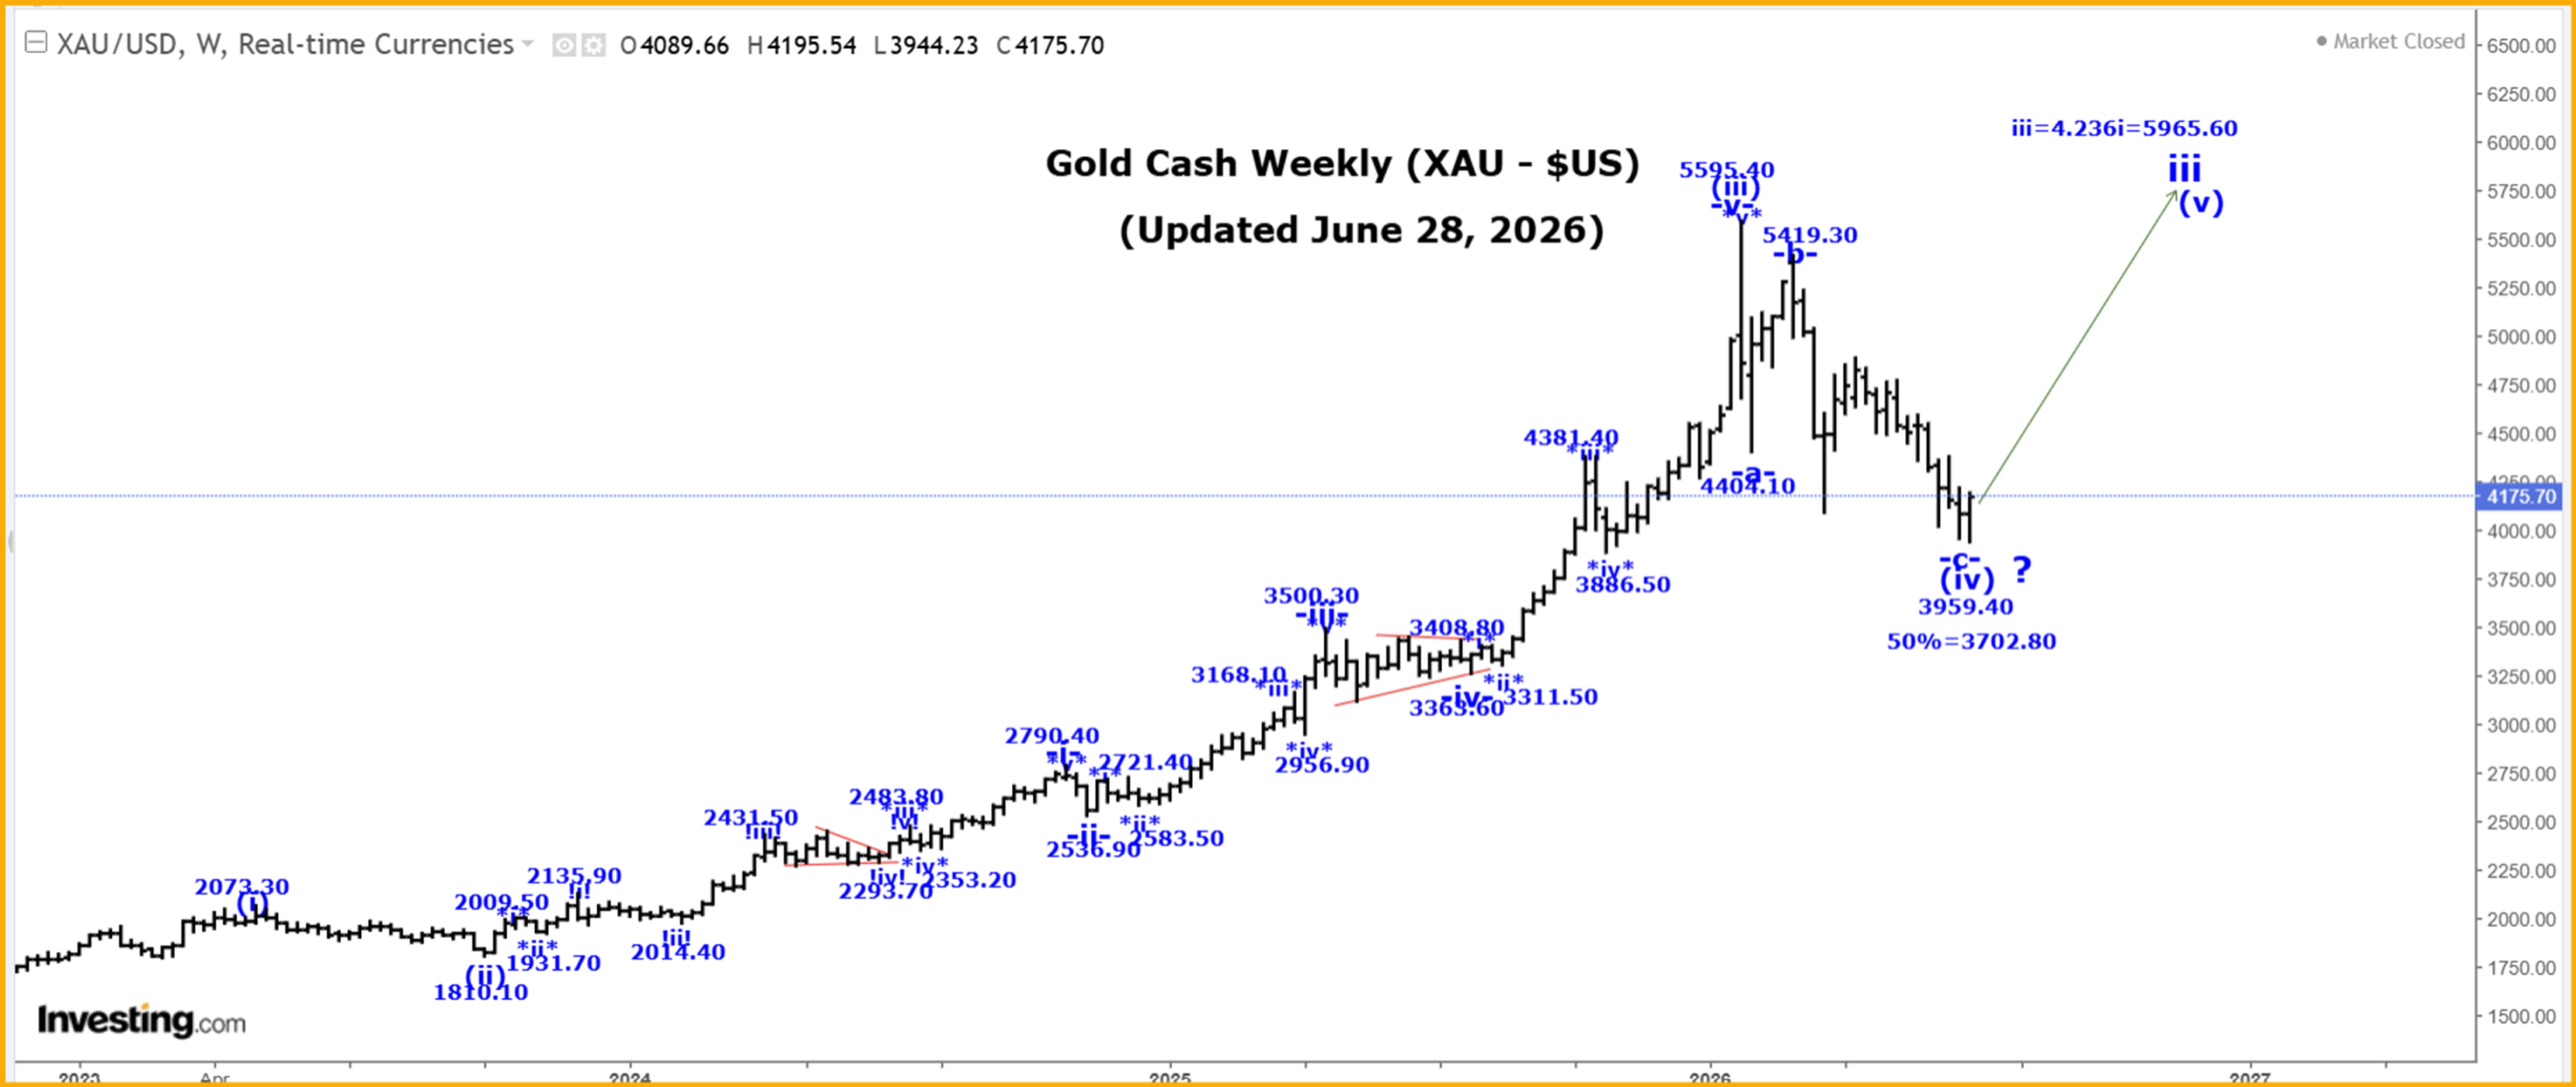
The Captain’s weekly gold chart.
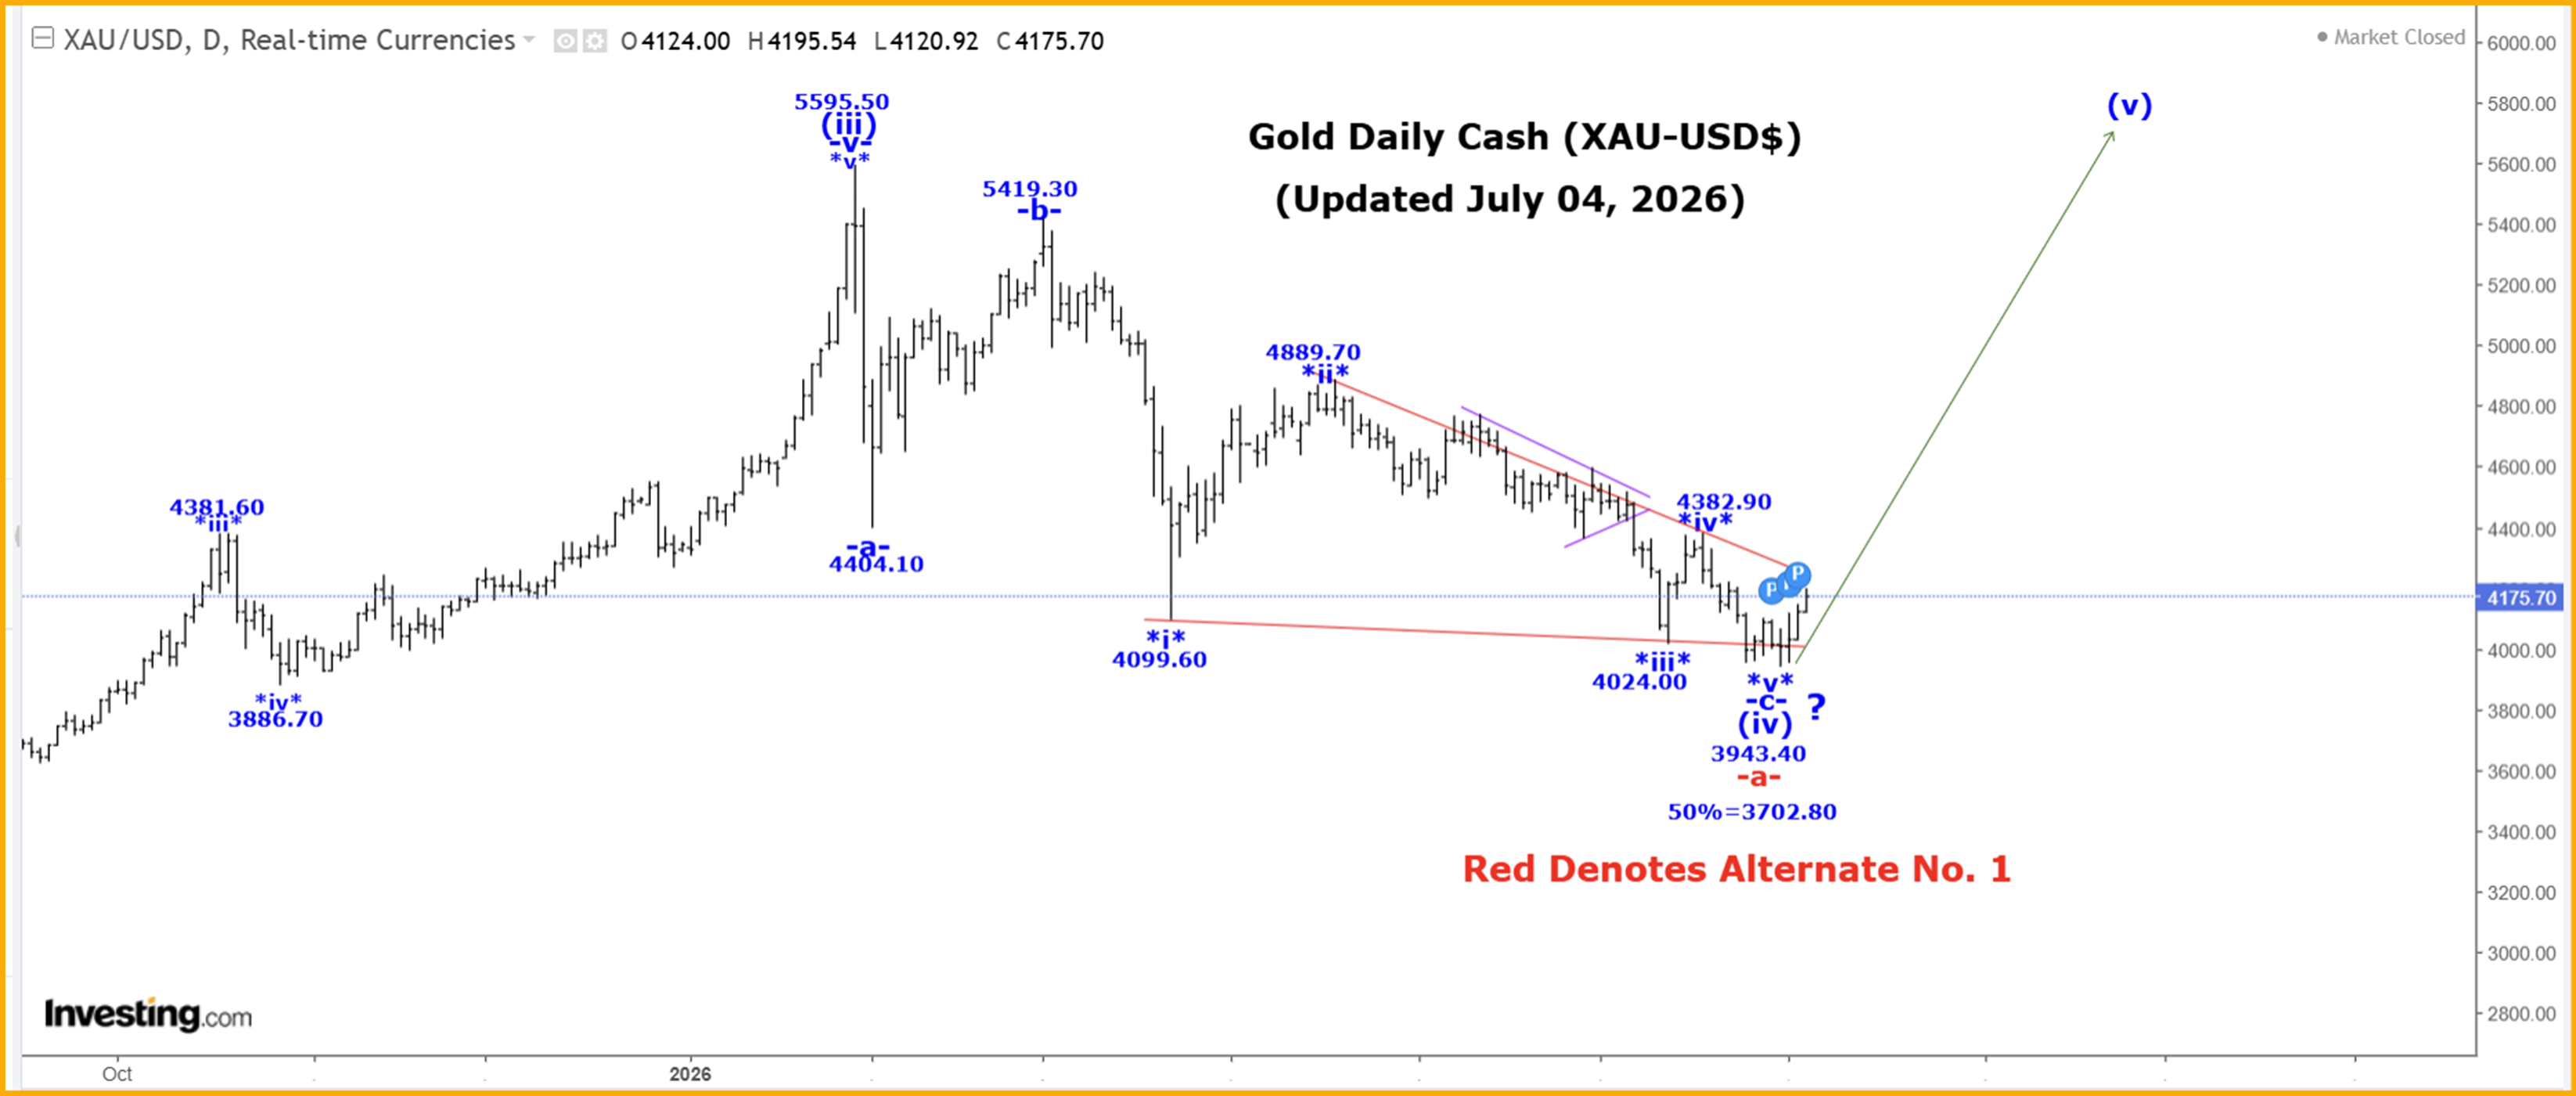
The Captain’s daily gold chart.
Analysis:
Gold is moving in a multi-decade incomplete impulsive fashion, form the 35.20 low made back in 1970. Within this impulsive move, we have the following count:
1 = 1920.80.
2 = 1046.20.
3:
i = 2073.40.
ii = 1614.40
iii:
(i) = 2073.30.
(ii) = 1810.10.
(iii) = 5595.40.
(iv):
-a- = 4404.10.
-b- = 5419.30.
-c- diagonal triangle:
*i* = 4099.60.
*ii* =4889.70.
*iii* = 4024.00.
*iv* = 4382.90.
*v* = 3943.40, if complete to complete all of wave (iv).
(v) rally after wave (iv) ends.
We are also watching an alternate that is suggesting that only wave -a- of (iv) is possibility complete or nearly complete at the 3959.40. In this case after wave -a- ends we expect a wave -b- rally.
Wave (iv) could still become a bullish triangle or a flat or irregular type correction, if only wave -a- ended at the 3959.40 low.
Projections for the end of wave 3 are:
3 = 2.618(1) = 5936.00.
3 = 4.236(1) = 9033.60.
Trading Recommendation: Long, with puts as stops!
Active Positions: Freshly long this week, with puts as stops!
Thank-you!
Captain Ewave & Crew
Read the full article here