

Aren’t stocks supposed to go up when you get a good jobs report? Not this time. The surprisingly good jobs report for both Canada and the US is our chart of the week. But the stock market fell, making what may be a key reversal week, suggesting a top may be in. Semiconductors, MAG7, FAANGS all hit. $2 trillion up in smoke.
We started looking at all sorts of reasons why this market might be on borrowed time. The ink was barely dry when it happened. Result bond yields rose, the US$ Index rose, gold and metals were smacked, and oil prices fell even as peace in the Middle East seems more remote than ever. President Trump won’t be happy. The likelihood of a rate cut at the June 17 FOMC seems more remote. They’re even expecting higher rates by year’s end. President Trump won’t be happy. However, in the face of possibly increased inflation, the ease of passing on higher prices to consumers is likely to bode well for food retailers such as Loblaw Companies Limited that expanded revenue, reported increased net earnings and higher free cash flow, pays a dividend and is held in the Enriched Capital Conservative Growth Strategy.*
This week, we get CPI and PPI for May. Expect higher. The Bank of Canada sets its interest rate on June 10. No cut or hike expected.
Good news. Summer is two weeks away. Have a great week!
DC
* Reference to the Enriched Capital Conservative Growth Strategy and its investments, celebrating an
8.25 – year history of 191% growth (annual 13.85%), is added by Margaret Samuel, President, CEO and Portfolio Manager of Enriched Investing Incorporated, who can be reached at 416-203-3028 or [email protected] This information should not be construed as an offer, or a solicitation of an offer or sale of any security. Past performance does not guarantee future returns.
“We can’t allow multinational oil companies boasting of record profits to gouge consumers . . . We must do what we can to fix this problem.”
—Stephanie Herseth Sandlin, American attorney, university administrator, member of the Democrat party, representing South Dakota (2004–2011), president Augustana University 2017–present; b. 1970
“So when you go up against the Far Right you go up against the big financial special interests like the Halliburton’s of the world, the big oil companies, the big energy companies who work so hard to rip us off.”
—Barbara Boxer, retired American politician, reporter who served in the U.S. Senate for California 1993–2017, member Democrat party, congresswoman (1983–1993); b. 1940
“The good Lord put oil and gas there for us to find and use, and we’d better do it.”
—Red Adair, American oil well firefighter, known internationally for his profession of extinguishing and capping oil wells; 1915–2004
“This time is different.” It’s a phrase we have heard often over the years. As we have noted before, the phrase comes from a book, This Time Is Different: Eight Centuries of Financial Folly, by Carmen M. Reinhart and Kenneth S. Rogoff, Princeton University Press (2009). Reinhart and Rogoff are two internationally recognized economists. The book is a lengthy 460 pages, sometimes written in economics lingo. So even we won’t suggest it should be essential reading.
The book notes that throughout history, rich and poor countries have been lending, borrowing, crashing, and recovering through a huge range of financial crises. It seems “this time is different” has been a common phrase, meaning that previous rules no longer apply and the current situation bears no resemblance to past financial disasters. Until it does.
However, it is a phrase we’ve heard time and time again: before the dot.com crash of 2000–2002, the housing market sub-prime loan collapse of 2007–2009 and yes, leading up to the Great Depression in 1929–1933. The book outlines numerous financial crises and defaults, even from the so-called top countries including the U.S., the U.K., France, and Germany. At one time they’ve either defaulted or faced a severe banking crisis, resulting in the collapse of sometimes multiple banks. If there is one thing different today, it is that regulation and capital requirements were tightened after the 2008 financial crisis. However, there are now ongoing attempts to unravel all the regulatory requirements. Does history repeat itself? Maybe not, but it does rhyme.
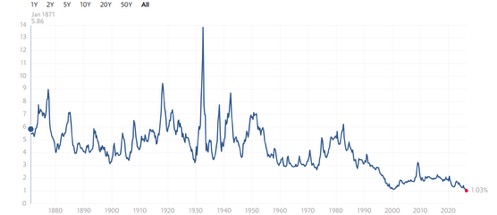
Our favourite indicator that shows how overvalued this market is the Shiller PE Ratio. At 42.84 it is near the record high seen at the peak of the late 1990s dot.com bubble. The mean since 1870 is 17.38. The prior peaks were before the Great Depression in 1929 and the dot.com collapse in 1999. Yet here we are, higher than we’ve ever been before – just shy of the all-time high.
Shiller PE Ratio 1870–2026
Source: www.multpl.com
S&P Dividend Yield 1870–2026
Source: www.multpl.com
A second indicator, not of all-time highs but all-time lows, is the S&P 500 dividend yield. With the S&P 500 dividend yield at 1.03% and the U.S. 10-year Treasury note at 4.45%, where would income seekers prefer to be?
S&P 500 Price to Sales Ratio 1996–2026
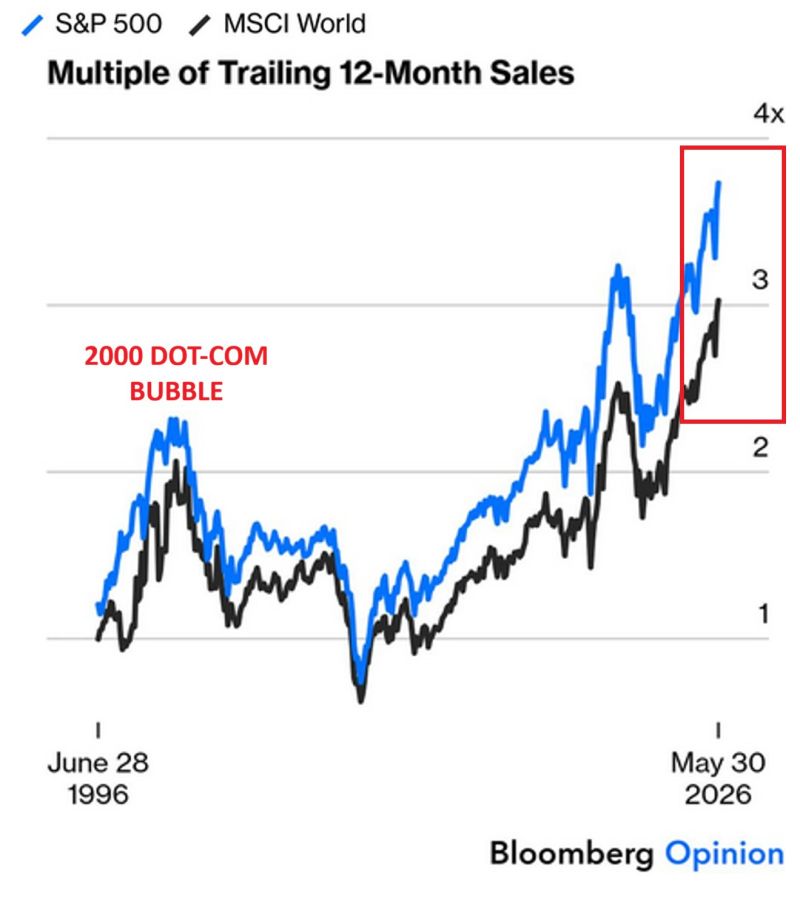
Source: www.bloomberg.com, www.syzgroup.com
Charles-Henry Monchau of the Syz Group (www.syzgroup.com) points out how the price-to-sales ratio is up to 3.7 times above the previous all-time high. It’s 60% above where it was at the dot.com high. Monchau notes that never in the history of financial markets have prices surpassed global companies’ sales to this extent.
The next chart shows the high level of concentration that has preceded every major stock market collapse over the past two centuries. This is reposted from Bank of America and Jim Bianco of Bianco Research. Each one of these bubbles represents a peak of financial folly:
- the railway mania of the 1830s followed by the depression of the 1840s, known as the Hungry 40s
- the utilities/telcos/industrials mania of the 1920s followed by the Great Depression (1929–1933)
- the Nifty Fifty bubble of 1972–1973, resulting in the steep recession of 1974–1975 and stagflation
- Japan in the 1980s followed by the Japanese depression of the 1990s
- the dot.com bubble of the 1990s followed by the early 2000s recession
- the current AI bubble to be followed by . . . who knows what?
Oddly enough, left out was the railway mania of the 1880s, known as the Gilded Age, that itself was preceded by the long depression of the 1870’s following the U.S. Civil War, then followed by the depression of the 1890s. And lest we forget, the housing bubble of the 2000s was followed the Great Recession (2007–2009).
Nonetheless, the latter two would still have been worthy additions, even if concentration was not at the heart of either of those collapses.
And now we have today. The chart indicates the heavy concentration of the MAG7, along with Broadcom, Advanced Micro Devices (AMD), and Micron as they make up roughly 40% of the S&P 500.
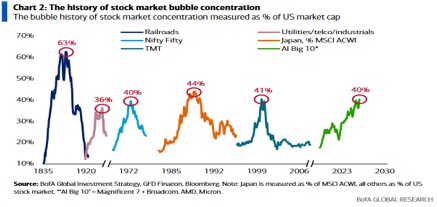
Source: www.business.bofa.com, www.biancoresearch.com, www.mauldineconomics.com
Each period was followed by a stock market collapse of varying degrees. The worst was the Great Depression (not included in the preceding chart) when the Dow Jones Industrials (DJI) fell 89%. A summary of each collapse is shown in this table. As noted, this is just for the DJI. The bubble stocks and other indices fell even more. Many of the dot.com bubble stocks fell 90% or more. Noteworthy was Nortel that went bankrupt, going from over $100/share to zero.
|
Period stock market peak to stock market trough |
Percentage % decline (DJI) |
|
Railway mania/Hungry 40s (1835–1843) |
73.5% |
|
The Gilded Age/The Long Depression (1881–1896) |
53.0% |
|
Roaring Twenties/Great Depression (1929–1932) |
89.0% |
|
Nifty Fifty/stagflation recession (1973–1974) |
45.0% |
|
Dot.com bubble/dot.com bust (2000–2002) |
38.7% |
|
Housing bubble/Great Recession (2007–2009) |
47.3% |
|
AI bubble/? |
? |
Source: www.stockcharts.com, www.goldchartsrus.com
Coming is the “mother” of all valuations: the SpaceX IPO, valued at potentially $1.78 trillion. There are also forecasts saying that AI revenue over the next five years will be 100-fold. We also have coming mega IPOs for Anthropic and OpenAI. Together they could top a valuation of $4 trillion. From what we can see, it is becoming a feeding frenzy.
In 2000, at the top of the dot.com bubble, there was also a frenzy of IPOs, including AT&T Wireless, Krispy Kreme Donuts, Pets.com, Garmin, and others. The frenzy proved to be the top of the market. Could the AI IPOs also signal the top of the market? Everyone appears to be falling all over each other to get a piece of the action. Buy the rumour, sell the news?
We can’t tell you exactly when this market will top. Nor do we know what might eventually cause the collapse. The AI frenzy is one thing, but usually at the heart of theses crises are banking crises. All we know is an old adage of economics: if something can’t go on forever, it won’t.
There is clearly risk in the ongoing wars, notably Russia/Ukraine and U.S./Israel/Iran/Hezbollah with our thoughts that the most dangerous to the world is the U.S./Israel/Iran/Hezbollah conflict. Negotiations are supposedly taking place, if we are to believe President Trump. But we learn they are not face-to-face – they’re through intermediaries Pakistan and Qatar. This may be communication, but it’s questionable communication. Trump has rejected Iran’s demands and Iran has rejected Trump’s demands. There is supposedly a ceasefire, but the ceasefire is broken regularly. So, what ceasefire? Nonetheless, the market continues to be whipsawed by the ongoing whims of a president who declares “peace is at hand” one day followed by “we’ll obliterate them” the next. This is a war with no real end in sight.
Trump is trying to keep the stock market alive, hopefully pushing oil prices lower, and the economy is doing well and will improve. But Trump’s credibility is beginning to wobble. The Strait of Hormuz effectively closed when the war began on February 28, 2026, and remains closed to this day – 100 days and counting. Ships run the risk of being bombed. Or if they are allowed through, they must pay a toll in Chinese yuan or Bitcoin. Insurance companies won’t insure anyone. Why would they? At best, it’s a stalemate as the result of a ceasefire or it’s escalation with the lean toward the latter. Surrender is not an option for Trump and Iran has no incentive to give in. Tying in the Israeli war against Hezbollah/Lebanon only complicates things.
Markets have not priced in the ongoing closure of the Strait of Hormuz and its negative impact on global supply chains for a raft of products and the subsequent inflation. When Trump’s credibility wears off, markets may be in for a violent reset. The bubble will prick. Interest rates could soar, threatening the U.S.’s $40 trillion in debt (and everyone’s else’s debt too). Yet today the market keeps believing the war will end, the Strait of Hormuz will reopen, and we’ll recover from the shock of it all. This time is different? The only thing different is the circumstances, which could lead to the next collapse.
Note: We wrote this prior to Friday’s jobs report collapse. As we will note – have the markets topped?
Chart of the week
US job numbers
US Employment Rate Unemployment Rate 2016–2026
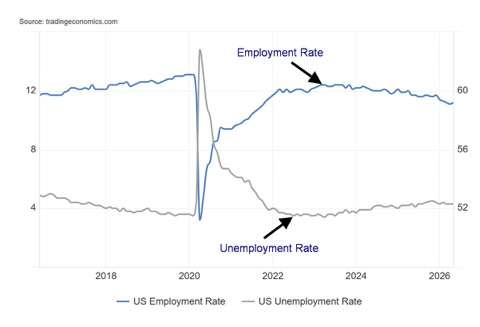
Source: www.tradingeconomics.com, www.bls.gov
In yet another surprise for the U.S. economy, nonfarm payrolls leaped 172,000 in May, well above the expected 85,000. It didn’t do a lot for the unemployment rate (U3) that remained at 4.3%. However, the U6 unemployment rate (total unemployed, plus all persons marginally attached to the labour force, plus total employed part-time for economic reasons, as a percent of the civilian labour force, plus all persons marginally attached to the labour force) fell to 8.1% from 8.2%.
Before we get too excited, however, we note that full-time employment actually fell 79,000 while part-time employment rose 266,000. The civilian labour force grew by 83,000 while the employment level was up
149,000. Both of those numbers come from the household survey as opposed to the nonfarm payrolls, which comes from the establishment survey. The unemployment level fell 66,000. The concern here is, yes, it was a strong report, but once one realizes that the jobs were part-time while full-time jobs fell doesn’t bode well for the latter. Part-time jobs can disappear as fast as they appear. The bulk of the jobs were in leisure and hospitality. Noteworthy, however, was that the number of manufacturing jobs increased, primarily for data centers and in defense. Other areas that grew were local governments.
The labour force participation rate was unchanged at 61.8% while the employment population ratio rose to 59.2% from 59.1%. They indicate what percentage of the population are working. The number for those deemed not in the labour force (NILF) fell 153,000 to 105,253 thousand. The NILF category is dominated by retirees, people with disabilities, and full-time students.
Due to the stronger than expected jobs report, bond yields rose, gold fell, while stocks also fell, dominated by the high-tech stocks and semiconductors. While the wide expectation is that the Fed will leave rates unchanged at the June 17 meeting (the first meeting led by Kevin Warsh), the strong report suggests that rates could still rise later, especially if high inflation persists due to high oil prices as a result of the U.S./Iran war.
The number of multiple job holders fell by 6,000 while an additional 110,000 were now unemployed 27 weeks or longer. The average number of weeks unemployed rose to 26.0 from 24.4 while the median weeks unemployed fell to 11.8 from 12.7.
The risk to this rosier than expected picture is the ongoing conflict between the U.S. and Iran. Despite all the talk of a ceasefire, the Strait of Hormuz remains mostly shut. Oil prices will remain elevated as a result.
If all this persists, consumer spending could wither. If the stock market weakens, that could have wealthier households also pulling back. Notably, employment fell sharply in the AI sector as the large firms shed employees. That could still spill over into the broader economy.
Canada job numbers
Canada Employment Rate Unemployment Rate 2016–2026
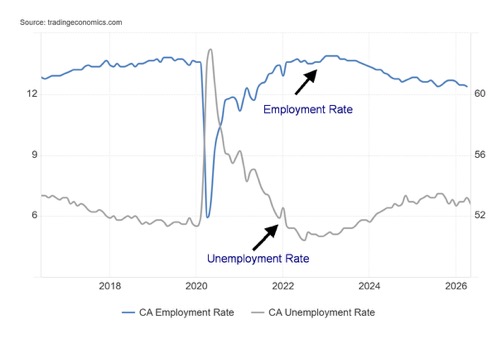
Source: www.tradingeconomics.com, www.statcan.gc.ca
In what had to be a complete surprise, Canada added 87,600 jobs in May, well above the estimated gain of 10,000. The unemployment rate fell to 6.6% from 6.9% while the R8 unemployment rate (the highest reported by Statistics Canada, plus discouraged searchers, waiting group, portion of involuntary part-timers) fell to 9.0% from 9.4%. A blockbuster report. A reminder that these reports can be subject to revisions. This is also good news, but during the first four months of the year Canada lost 112,000 jobs so this is just a nice recovery, recouping roughly 80% of earlier losses.
Markets celebrated with the Canadian dollar rallying, but the bond market didn’t like it and prices fell, while yields (which move inversely to price), rose. Of the jobs, full-time employment gained 154,000 jobs, well above the expected 35,000, while part-time employment fell 66,200 jobs vs. an expectation of losing 23,000 jobs. The participation rate fell to 65.0% from 65.1%. The employment population ratio fell to 60.5% from 60.6%.
The stronger than expected jobs report leaves the Bank of Canada (BofC) in a quandary for its June 10 interest rate decision. While it’s expected that the BofC will leave rates unchanged, some might be calling for a hike because of the growing inflation problem. Still, we’d put better odds on rates remaining unchanged. Some preliminary reports are indicating that the Canadian economy is growing again in Q2. That also would have the BofC leaving rates alone with some risk of a hike. Construction saw solid job gains while retail trade suffered losses. Ontario had the most gains.
All this came against the background of uncertainty created by the U.S.’s trade and tariff policies, along with the ongoing musings from President Trump to make Canada the 51st state. The sharp gain in jobs also questions the results of Q1 GDP that saw the Canadian economy flat, following a 0.2% decline Q4 2025. Canada entered what some term a technical recession: i.e., two consecutive quarters of negative growth. Most economists dismissed that terminology. All this could be subject to revisions.
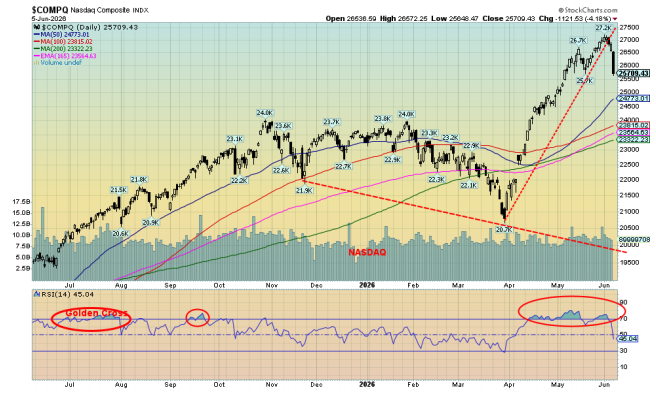
Stocks
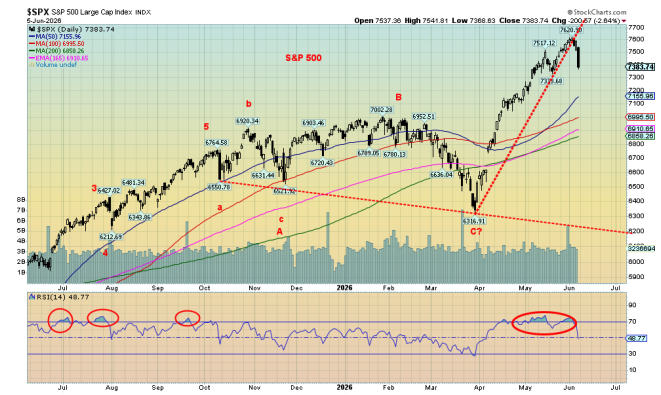
Source: www.stockcharts.com
Is the party over? That’s a question we have to ask ourselves after Friday’s mega drop in the stock market, following the higher than expected nonfarm payrolls. Rising employment put pressure on interest rates as bond yields rose while the US$ Index strengthened. From a more technical perspective, Friday’s decline was an outside reversal week on the charts for the S&P 500 and other indices. An outside reversal is when an index, stock, etc. makes new highs and, in this case, new all-time highs, then reverses, and closes below the low of the previous week. We call that a key reversal week. A key reversal day is bad, but a key reversal week could suggest that this week we saw the high for some time to come.
The decline was led by semiconductors. The S&P 500 fell 2.6%, the Dow Jones Industrials (DJI) dropped 0.3%, while the NASDAQ fell 4.7%. And to no one’s surprise, the NY FANG Index dropped 7.6%. All this came after all made new all-time highs. When we looked at MAG7 and others, we noted that Snowflake, Broadcom, AMD, and CrowdStrike all made all-time highs and closed lower. Hardest hit was Broadcom, down 13.3%. Of the MAG7, Meta fell 6.2%, Amazon was down 9%, Microsoft was off 7.4%, and Tesla was down 10.2%. Apple, Google, and Nvidia also fell, just not as much. Was there any good news? The Dow Jones Transportations (DJT) gained 2.4%. Seems the market believes transportation stocks will thrive in this environment.
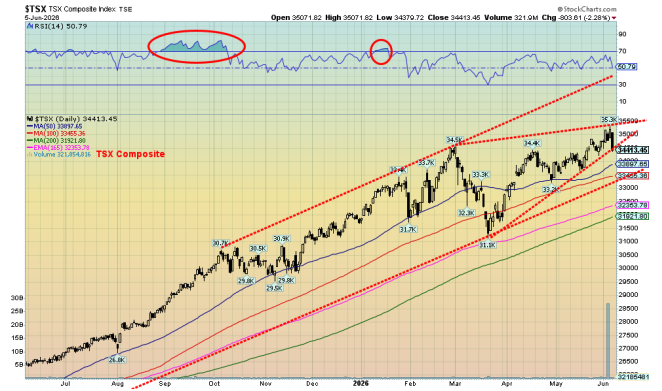
Elsewhere, the S&P 400 (Mid) fell 0.9% after reaching an all-time high, the S&P 600 (Small) fell 0.7%, while the S&P 500 Equal Weight Index dropped 0.5%, also after reaching an all-time high. In Canada, the TSX Composite fell 1.0% after making an all-time high. The TSX Venture Exchange (CDNX) was whacked down 5.4% as investors threw away the already undervalued junior mining stocks. Of the TSX sub-indices, nine of the 14 were actually up on the week, led by Health Care (THC), which rose 5.1%. But THC is a small component. More significantly, the Financials (TFS) rose 1.3% and reached all-time highs. Despite all the positive sub-indices, it was Golds (TGD), Metals (TGM), and Materials (TMT) pulling the TSX down as they lost 10.4%, 8.6%, and 9.8% respectively. Consumer Staples (TCS) also did well, up 4.8%. That sector is a good place to hide-in if things turn down.
Source: www.stockcharts.com
In the EU, the London FTSE fell 0.4%, the EuroNext rose 0.7%, the Paris CAC 40 was up 0.4%, while the German DAX fell 1.4%. In Asia, China’s Shanghai Index (SSEC) fell 1.0%, the Tokyo Nikkei Dow (TKN) made all-time highs again, up 0.4%, Hong Kong’s Hang Seng (HSI) lost 0.9%, while India’s Nifty Fifty fell 0.8%. It seems all the action was in New York. Will foreign indices catch up this coming week? The MSCI World ex USA Index fell 3.3% after making an all-time high.
We can’t call a top just yet. But it’s not looking good. Below S&P 500 7,300 and NASDAQ 25,700 (we’re close) we could proclaim a top is in. But will this move turn into a nastier move to the downside or will it peter out like many previous drops?
The decline this week wiped some $2 trillion off stock market valuations. Previously, when the Fed made cuts, it was because the economy was showing weakness. Now the jobs report indicates strength. Earlier, even the JOLTS report showed that job openings rose, not fell, as many expected. Naturally, President Trump couldn’t risk talking about the drop, saying “stocks should go up, not down” after the stronger jobs report. But fear of interest rate hikes crept in as bond yields rose, and economists stopped talking about a Fed interest rate cut at the upcoming June 17 FOMC. The market wants to focus on economic weakness or strength, profits, and not on whether the price of oil went up because of a war over there.
Source: www.stockcharts.com
The world’s largest IPO is just days away: SpaceX, with an estimated $75 billion to be raised, giving SpaceX a market cap of some $1.7 trillion. The ticker symbol is SPCX. So maybe the market was selling on Friday to raise funds to put in the SPCX IPO. Bitcoin was also whacked, down 16.5% on the week. Maybe crypto funds into SPCX as well? Anyway, events like this often signal a market top.
We are not calling a market top just yet. Notably, the daily short-term trends weakened but they did not turn down yet. Another week like this and they will. However, the market can also be battered back and forth by the whims of the president as to whether a peace deal is at hand or not. Nonetheless, the key reversal and decline this past week is a signal the party may indeed be over.
Source: www.stockcharts.com
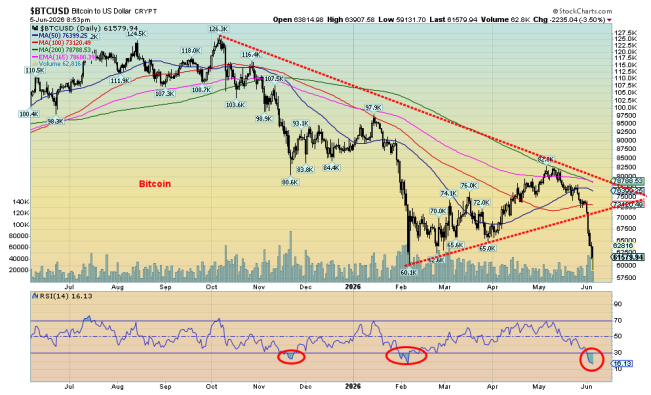
It appears that Bitcoin is breaking down. This past week saw a nasty drop breaking trendline support. That flag pattern projects potentially to a decline to around $47,000. Bitcoin (BTC) is now down 52% from its all-time high seen in October 2025. Is crypto dead? Probably not, but it appears it might be going through another shakedown as we saw in 2018 when BTC lost 84% and again in 2022 when BTC fell 77%. Given we have a clear five-wave advance from beginnings in 2014, this decline could prove to be devastating. The good news is that BTC is deeply oversold so a rebound might not be a surprise. However, it is not a place we’d recommend being in. Holders of BTC and other crypto might want to pay attention.
Bonds
Source: www.tradingeconomics.com, www.home.treasury.gov, www.bankofcanada.ca
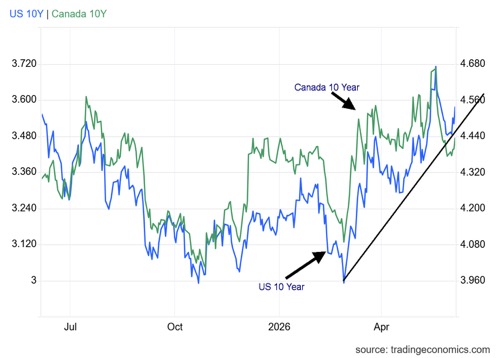
The surprise U.S. job numbers on Friday helped push the U.S. 10-year Treasury note up 6 bp. On the week, it was up 11 bp to 4.55%. In Canada, it was the same as Canada too had solid job numbers. The 10-year Canadian Government Bond (CGB) rose a more modest 4 bp to 3.48%. Notably the U.S. 2-year treasury note hit its highest level since early 2025 up 14 bp. Rate hikes anyone? The bond market interpreted that the job market remains strong and that as a result it will be difficult for the FOMC to cut rates at the June 17 meeting. They won’t hike either, but the market is now pricing in a 25 bp hike by year end.
The Bank of Canada meets this week on June 10 for the interest rate decision. The market expects no change, leaving the key bank rate at 2.25%. Canada’s economy had been showing weakness, but Friday’s blowout jobs report softened that stance. Inflationary pressures from tariffs and oil suggest stagflation but nobody has deemed that the case yet.
Other important numbers coming up this week are the May CPI and inflation rate along with the PPI. The market is expecting the year-over-year inflation rate to rise to 4.0% from 3.8%. That’s nowhere near the Fed’s target of 2%. The pressure is to raise rates, but that won’t happen. Not yet anyway. One might also watch the Michigan Consumer Sentiment Index that’s out on June 12, expected at 46 vs. 44.8 in the last report. Still pretty dreary.
The chart suggests rates should rise further. But then peace might break out. Or at least the perception of peace. Then bond yields will fall.
Gold and silver
Source: www.stockcharts.com
It was a miserable week for the gold bugs – on Friday especially, after the release of the job numbers. The higher than expected job numbers set off alarms that the economy is growing, that they won’t have to cut interest rates, and bond yields rose. All this makes holding gold, which has a cost of carry, less appealing and as a result the sell button was hit. Friday’s collapse in the stock market didn’t help. When the stock market catches cold, gold and gold stocks catch pneumonia.
We’ve seen this picture before, most notably during the 2008 financial crisis and the 2020 pandemic panic. Note that the S&P 500 fell 52.3% in 2007–2009 while the Gold Bugs Index (HUI) dropped 71.1%, all in 2008. In 2020 the S&P 500 fell 35.4% during the March 2020 panic while the HUI fell 45.3%. We’ve seen the same phenomena during other market declines. The good news is, despite the drop for the HUI, gold and the gold stocks recovered first and we’re soon at new all-time highs. Maybe there is a pattern.
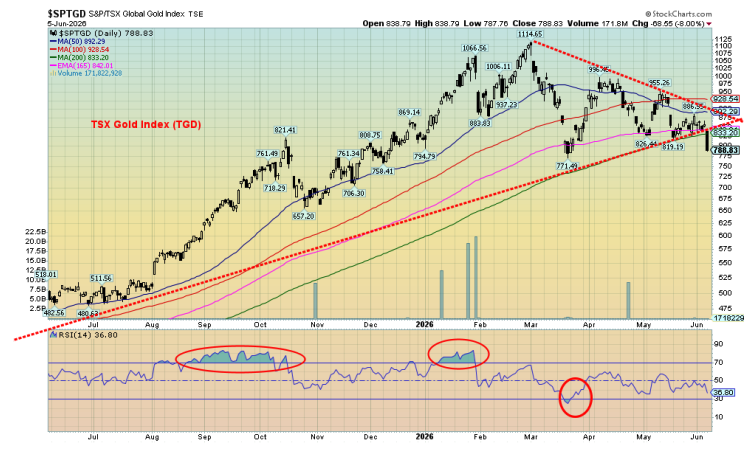
However, Friday was a bear raid. If there is one concern, it is that gold, the HUI, and the TSX Gold Index (TGD) all broke below and closed below their 200-day MA’s. Silver did not, but it’s getting close. That the US$ Index had a big up day also weighed on the gold market. U.S. treasury yields ticked higher.
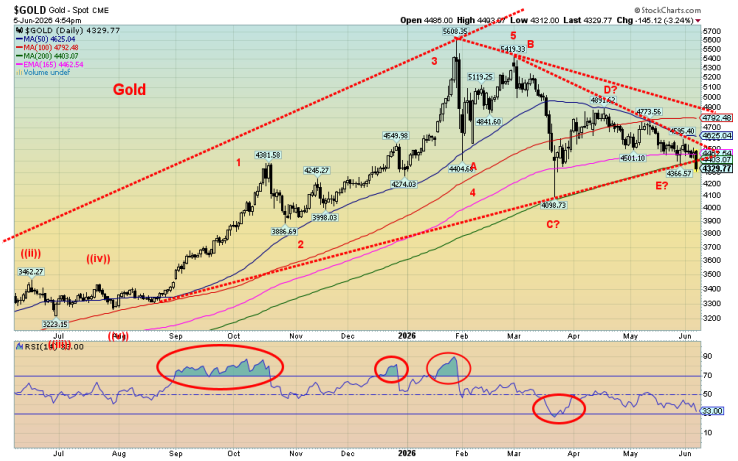
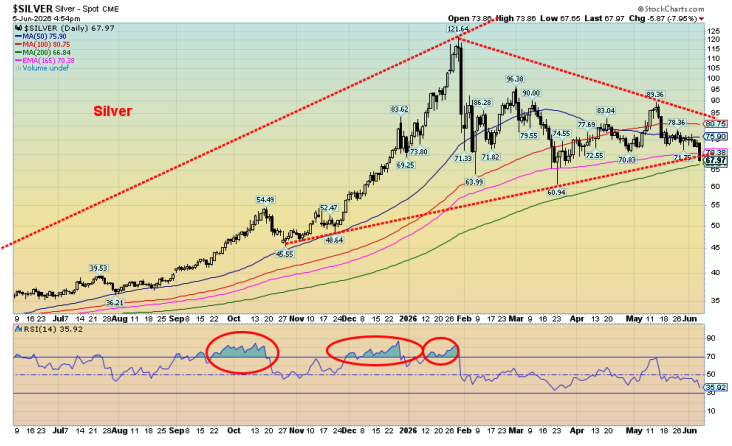
The declines on Friday were a bit rollicking. On Friday, gold fell 3.2%, silver was down almost 8%, while the TSX Gold Index (TGD) fell 8.0% as well. On the week, gold was down 5.0%, silver was off 10.5%, the HUI was down 11.7%, and the TGD was off 10.4%. Platinum was hit, down 7.9%, palladium fell about 10.0%, while copper fared the best, down only 2.0%. Not helping was a stronger US$ Index and thoughts that the Fed might raise rates at the June FOMC. Given it’s Kevin Warsh and there’s pressure to keep rates down, we doubt that will happen.
Source: www.stockcharts.com
We won’t pretend that the fall under 200-day MA is not of concern. It is. We also busted what appeared to be a forming symmetrical triangle for gold, except that we broke down, not up. All have become quickly oversold with RSIs in the low 30s but not yet under 30. We could argue that the symmetrical triangle was actually a descending triangle. If that’s right, gold’s target could be $3,000, another $1,000 lower. The TGD’s target is down to around 500. One reason we find all that spurious is, in theory, silver could be wiped out. The odds of that happening are zero.
We are also entering a seasonal period more friendly to gold. However, that could still leave our final low off until July. Nonetheless, mini bears are now in place. The daily trend for all is pointed down while the more important intermediate trend is neutral. Another bad week and that could turn down too. The long-term trend remains up but weakening.
Should we be concerned? Yes, but some keys might be follow-through this coming week. Weak follow-through would be encouraging but not necessarily signal the end of the decline. What they might hope for is more talk from the White House that peace is at hand. It wouldn’t be surprising, given the president’s penchant for whipsawing the market and his desire for lower oil prices, a higher stock market, and lower bond yields.
Gold is down almost 23% from its all-time high, silver down 44% and the TGD off 29%. All bear markets. That’s the bad news but the good news is gold is up 168% from its key 2022 low, silver up 287%, while the TGD is up 258%. Is the glass half full, or half empty?
The decline this past week was a bit scary. However, we remain optimistic that we’re staying in a long-term bull market and this has just been a nasty correction following the big run-up in 2022–2026. Certainly, raids like this push all the weak longs out of the market.
For those interested in more detail than we provide, Ed Steer’s weekly column is an interesting read. (https://silverseek.com/article/brutal-bear-raid-golds-200-day-moving-average-falls.) It is, however, quite technical and lengthy so it is not for everyone.
Source: www.stockcharts.com
Oil and gas
Source: www.stockcharts.com
One would think that with both the U.S. and Iran exchanging bombs oil prices would move higher again. Not so. Yes, oil prices did rise this past week but came off on Friday after the U.S. jobs report. The U.S./Iran and as well Israel/Hezbollah all talk a great line on a how ceasefire is at hand, but then you look and bombs continue to be hurled at each other. Some ceasefire. The narrative that peace is at hand is becoming tiresome. We note that the U.S. and Iran don’t actually talk to each other but instead it’s all through the intermediary, Pakistan.
If there was one thing that seemed to help lower oil prices this past week, it was that Oman’s main port was up and running again. That helped cap the Brent crude price. They had suspended operations because Iranian drones hit the terminal. On the week, WTI oil rose 2.8% while Brent crude was up 2.2%. Natural gas (NG) was again mixed with NG at the Henry Hub off 2.1% but NG at the EU Dutch Hub rose 6.1%. The Dutch Hub is more dependent on LNG from the Middle East. The oil indices responded positive with the ARCA Oil & Gas Index (XOI) up 2.7% and Canada’s TSX Energy Index (TEN) up 1.9%. However, thoughts that this would carry through ended on Friday when WTI Oil fell $2.90 or 3.1%. NG was also down.
Source: www.oilprice.com
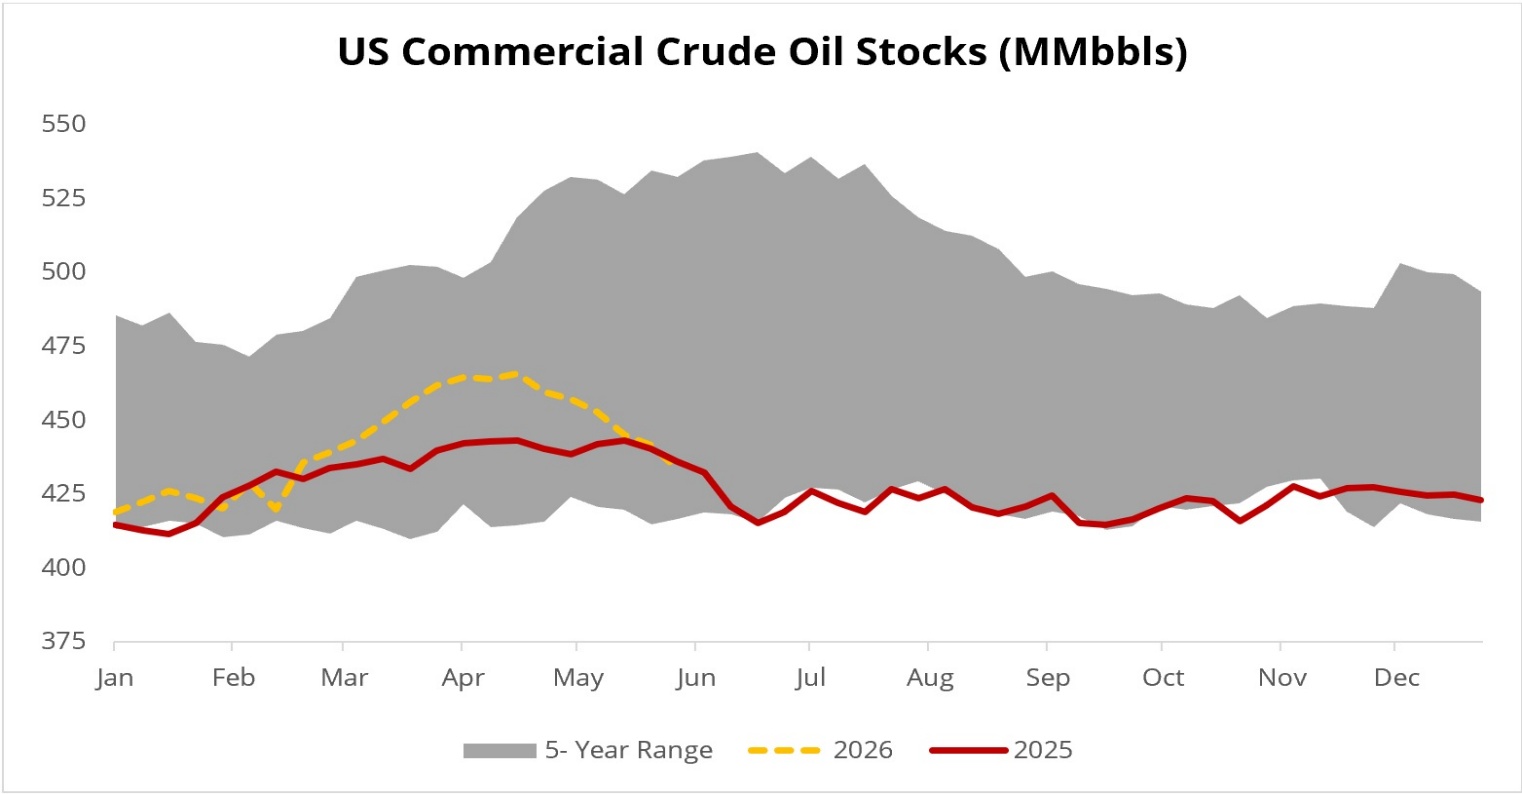
One concern has been the dwindling oil stocks in the U.S. As the chart from www.oilprice.com shows, crude stocks are trending along the 5-year low. It’s been that way now for the past year as the U.S. tries to mitigate the high oil price by releasing stocks. At some point they will have to replenish these stocks.
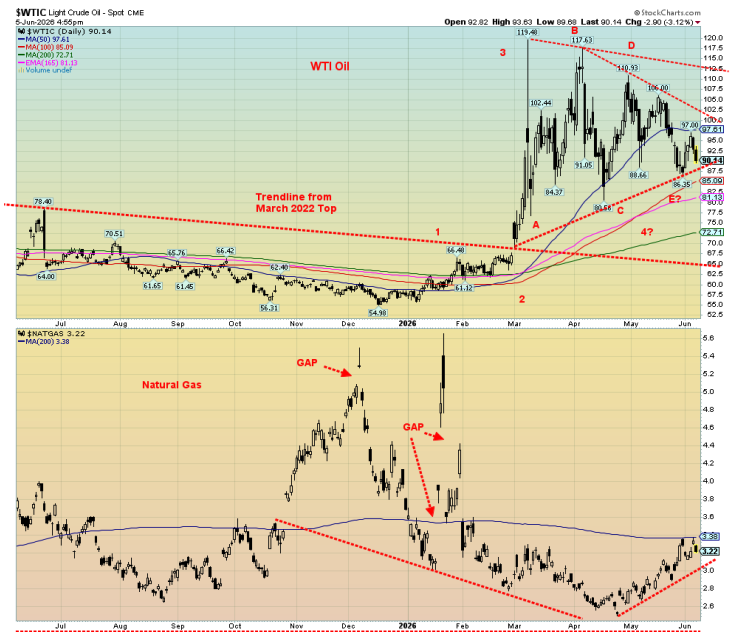
Technically, we continue to be encouraged by the ongoing appearance of a large symmetrical triangle for WTI. If the pattern is correct, then a break above $102.50 would then project WTI up to $140/$142. We’d need to break above $112.50 to confirm the breakout and a low. A break under $87.50 would change the nature of the pattern. Next support would be $81/$82. Under $81 we could fall towards $70. But if all that were to happen, then peace would have broken out in the Middle East. As they say, don’t hold your breath.
NG ran into resistance at the 200-day MA. Failure to break over it and hold over it makes the rally in NG suspicious, and that all this was, was a bear market rally. We’d have to get over $3.60 to suggest this NG bear is over.
Markets and Trends
|
|
|
|
% Gains (Losses) Trends |
|
||||
|
|
Close Dec 31/25 |
Close Jun 5/26 |
Week |
YTD |
Daily (Short Term) |
Weekly (Intermediate) |
Monthly (Long Term) |
|
|
|
|
|
|
|
|
|
||
|
S&P 500 |
6,845.50 |
7,383.68 (new highs) * |
(2.6)% |
7.9% |
up (weak) |
Up |
up |
|
|
Dow Jones Industrials |
48,063.29 |
50,866078 (new highs) * |
(0.3)% |
5.8% |
up |
up |
up |
|
|
Dow Jones Transport |
17,357.19 |
21,913.53 |
2.4% |
26.3% |
up |
up |
up |
|
|
NASDAQ |
23,241.99 |
25,709.43 (new highs) * |
(4.7)% |
10.6% |
up (weak) |
up |
up |
|
|
S&P/TSX Composite |
31,712.76 |
34,413.64 (new highs) * |
(1.0)% |
8.5% |
up |
up |
up |
|
|
S&P/TSX Venture (CDNX) |
987.74 |
956.61 |
(5.4)% |
(3.2)% |
down |
neutral |
up |
|
|
S&P 600 (small) |
1,467.76 |
1,672.89 |
(0.7)% |
14.0% |
up |
up |
up |
|
|
ACWX MSCI World x US |
67.18 |
73.95 (new highs) * |
(3.3)% |
10.1% |
neutral |
up |
up |
|
|
Bitcoin |
87,576.98 |
61,438.36 |
(16.5)% |
(29.9)% |
down |
down |
neutral |
|
|
|
|
|
|
|
|
|
|
|
|
Gold Mining Stock Indices |
|
|
|
|
|
|
|
|
|
Gold Bugs Index (HUI) |
701.49 |
674.58 |
(11.7)% |
(3.8)% |
down |
neutral |
up |
|
|
TSX Gold Index (TGD) |
817.76 |
788.87 |
(10.4)% |
(3.5)% |
down |
neutral |
up |
|
|
|
|
|
|
|
|
|
|
|
|
Bonds% |
|
|
|
|
|
|
|
|
|
U.S. 10-Year Treasury Bond yield |
4.17% |
4.55% |
2.5% |
9.1% |
|
|
|
|
|
3.3Cdn. 10-Year Bond CGB yield |
3.44% |
3.48% |
2.4% |
1.2% |
|
|
|
|
|
Recession Watch Spreads |
|
|
|
|
|
|
|
|
|
U.S. 2-year 10-year Treasury spread |
0.69% |
0.38% |
(11.6)% |
(44.9)% |
|
|
|
|
|
Cdn 2-year 10-year CGB spread |
0.85% |
0.61% |
1.7% |
(28.2)% |
|
|
|
|
|
|
|
|
|
|
|
|
|
|
|
Currencies |
|
|
|
|
|
|
|
|
|
US$ Index |
98.26 |
100.07 |
1.2% |
1.8% |
up |
up |
down |
|
|
Canadian $ |
72.87 |
71.68 |
(1.1)% |
(1.6)% |
down |
down |
down |
|
|
Euro |
117.48 |
115.19 |
(1.2)% |
(2.0)% |
down |
down |
up |
|
|
Swiss Franc |
126.21 |
125.57 |
(1.9)% |
(0.5)% |
down |
neutral |
up |
|
|
British Pound |
134.78 |
133.32 |
(1.0)% |
(1.1)% |
down |
neutral |
up |
|
|
Japanese Yen |
63.83 |
62.78 |
(0.1)% |
(1.6)% |
down |
down |
down |
|
|
|
|
|
|
|
|
|
|
|
|
Precious Metals |
|
|
|
|
|
|
|
|
|
Gold |
4,311.97 |
4,313.40 |
(5.0)% |
flat |
down |
neutral |
up |
|
|
Silver |
71.16 |
67.62 |
(10.5)% |
(5.0)% |
down |
neutral |
up |
|
|
Platinum |
2,046.90 |
1,772.90 |
(7.9)% |
(13.4)% |
down |
neutral |
up |
|
|
|
|
|
|
|
|
|
|
|
|
Base Metals |
|
|
|
|
|
|
|
|
|
Palladium |
1,619.50 |
1,237.00 |
(10.0)% |
(23.6)% |
down |
down |
up (weak) |
|
|
Copper |
5.64 |
6.23 |
(2.0)% |
10.5% |
neutral |
up |
up |
|
|
|
|
|
|
|
|
|
|
|
|
Energy |
|
|
|
|
|
|
|
|
|
WTI Oil |
57.44 |
90.29 |
2.8% |
57.2% |
down |
up |
up |
|
|
Nat Gas |
3.71 |
3.21 |
(2.1)% |
(13.5)% |
up |
neutral |
neutral |
|
Source: www.stockcharts.com
* New All-Time Highs
Note: For an explanation of the trends, see the glossary at the end of this article.
New highs/lows refer to new 52-week highs/lows and, in some cases, all-time highs.
Copyright David Chapman 2026
GLOSSARY
Trends
Daily – Short-term trend (For swing traders)
Weekly – Intermediate-term trend (For long-term trend followers)
Monthly – Long-term secular trend (For long-term trend followers)
Up – The trend is up.
Down – The trend is down
Neutral – Indicators are mostly neutral. A trend change might be in the offing.
Weak – The trend is still up or down but it is weakening. It is also a sign that the trend might change.
Topping – Indicators are suggesting that while the trend remains up there are considerable signs that suggest that the market is topping.
Bottoming – Indicators are suggesting that while the trend is down there are considerable signs that suggest that the market is bottoming.
Disclaimer
David Chapman is not a registered advisory service and is not an exempt market dealer (EMD) nor a licensed financial advisor. He does not and cannot give individualised market advice. David Chapman has worked in the financial industry for over 40 years including large financial corporations, banks, and investment dealers. The information in this newsletter is intended only for informational and educational purposes. It should not be construed as an offer, a solicitation of an offer or sale of any security. Every effort is made to provide accurate and complete information. However, we cannot guarantee that there will be no errors. We make no claims, promises or guarantees about the accuracy, completeness, or adequacy of the contents of this commentary and expressly disclaim liability for errors and omissions in the contents of this commentary. David Chapman will always use his best efforts to ensure the accuracy and timeliness of all information. The reader assumes all risk when trading in securities and David Chapman advises consulting a licensed professional financial advisor or portfolio manager such as Enriched Investing Incorporated before proceeding with any trade or idea presented in this newsletter. David Chapman may own shares in companies mentioned in this newsletter. Before making an investment, prospective investors should review each security’s offering documents which summarize the objectives, fees, expenses and associated risks. Although Artificial Intelligence (AI) may be deployed from time to time, AI output is monitored and adjusted, if necessary, for accuracy. David Chapman shares his ideas and opinions for informational and educational purposes only and expects the reader to perform due diligence before considering a position in any security. That includes consulting with your own licensed professional financial advisor such as Enriched Investing Incorporated. Performance is not guaranteed, values change frequently, and past performance may not be repeated.
Read the full article here