

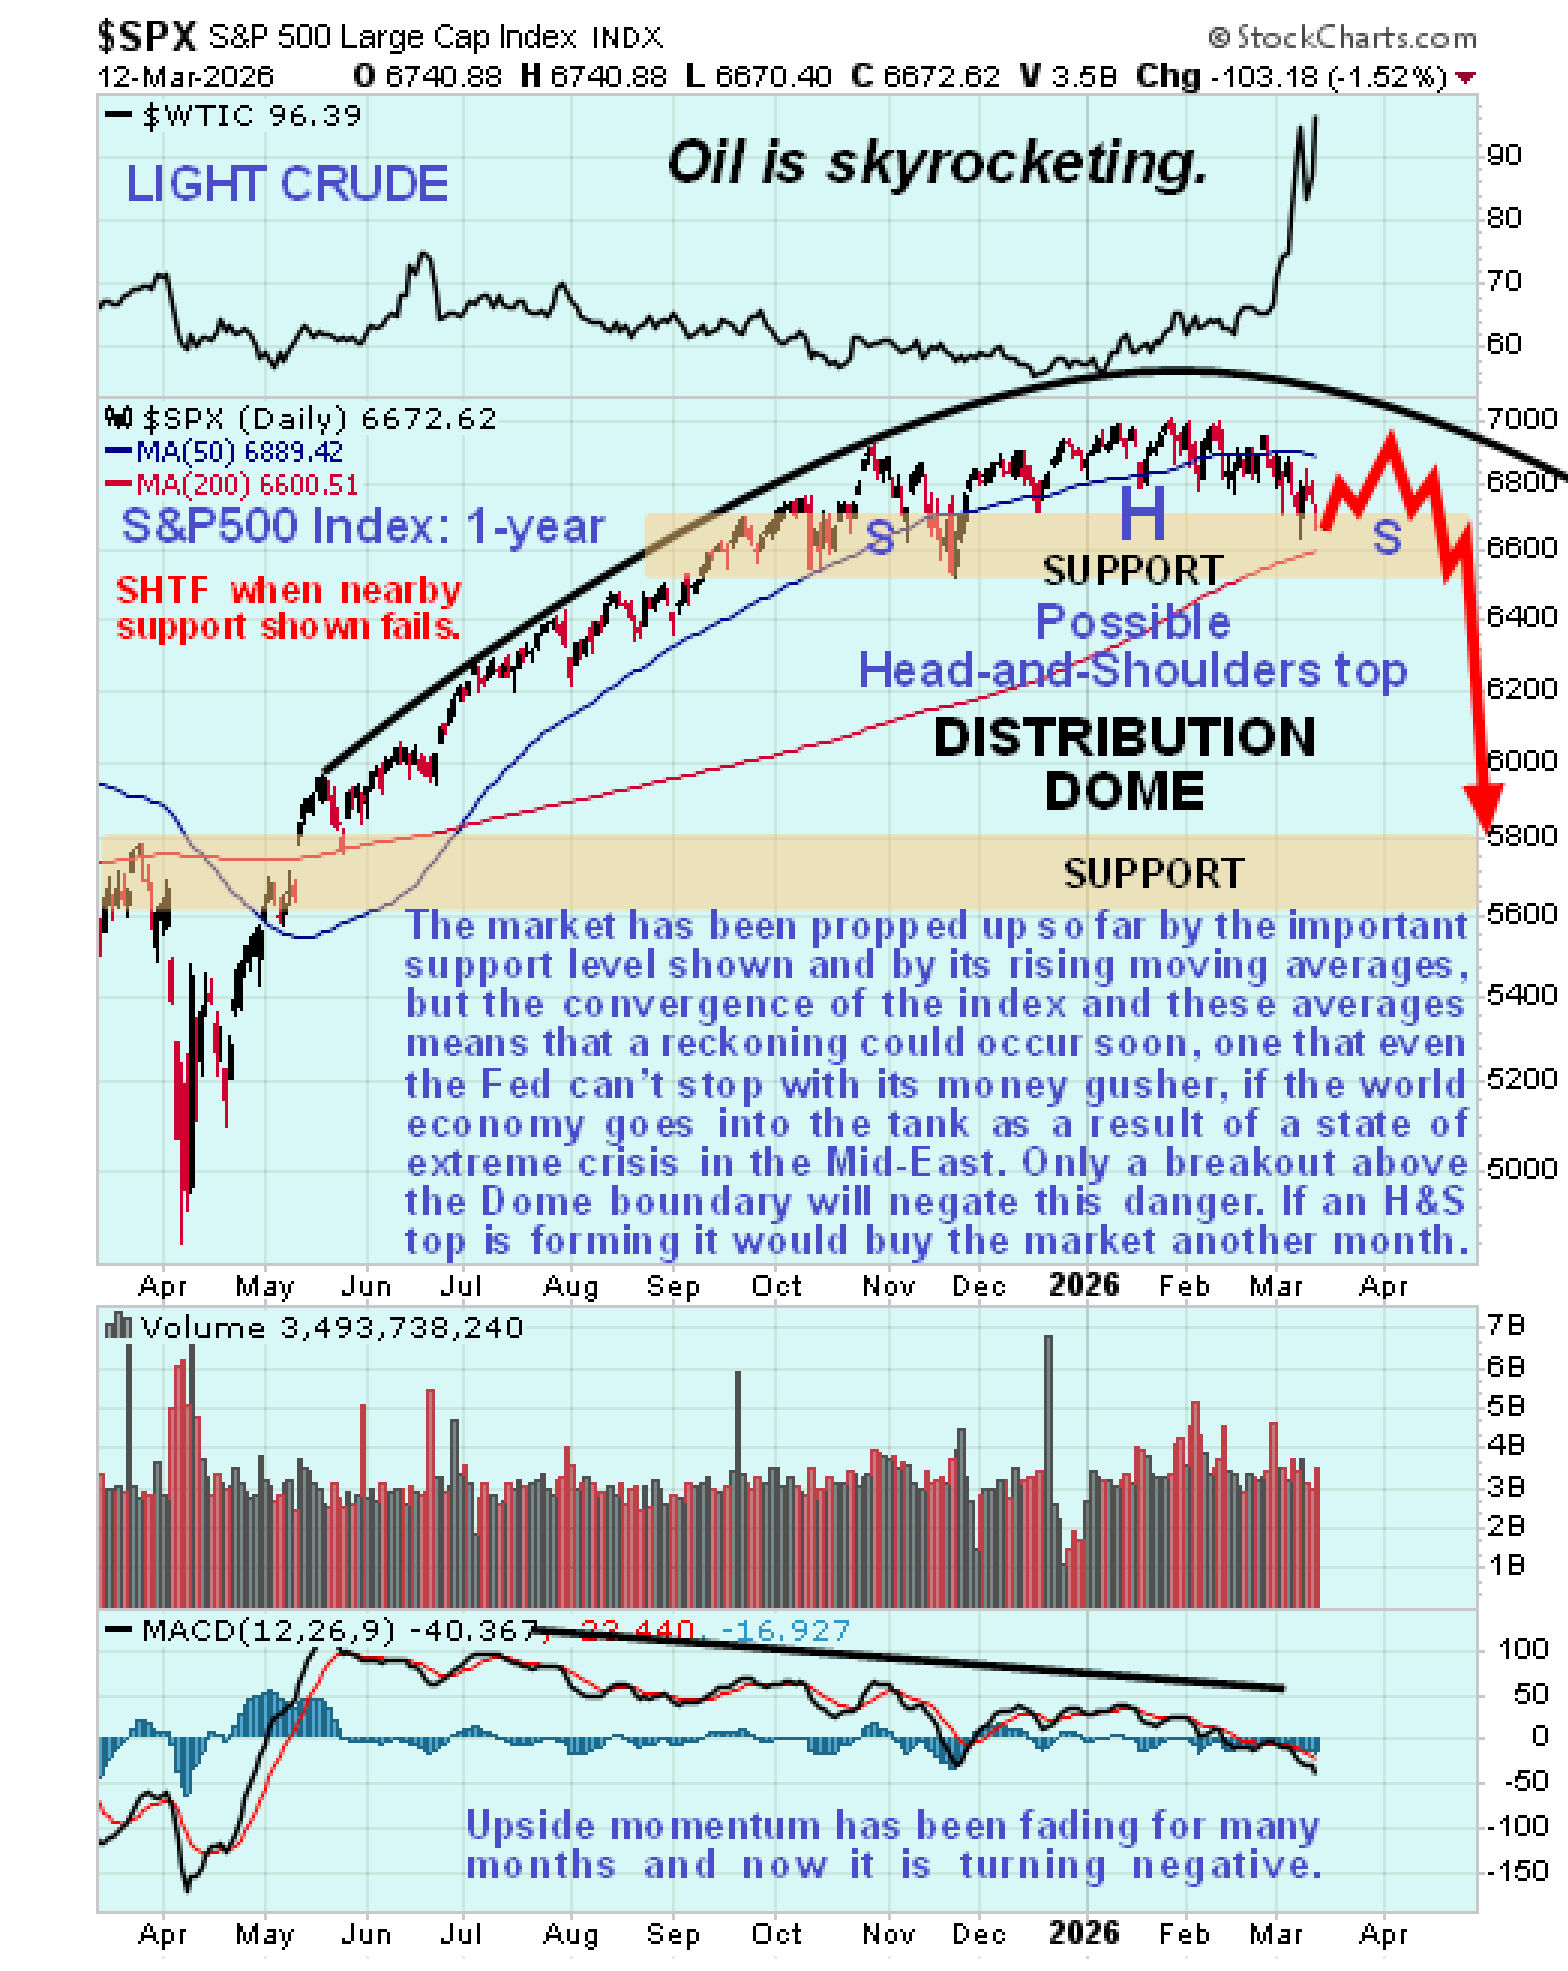
Given what’s going on in the world, it’s truly remarkable that the US stock markets have held up as well as they have, but it’s not easy slaying a multi-year bull. Now, however, as we look at the 1-year chart for the S&P500 index shown further down the page, we see that it has been eroding support near to its rising 200-day moving average in the recent past to the point that this support is now believed to be on the point of failure.
Fundamentally, it’s not hard to see why the market will crash soon – although Israel and the US have done a lot of damage to Iran, they are a long way from winning this war and are doing far worse than the mainstream media would have you believe and the US faces the prospect of being run out of the Mid-East which will signal the end of the petrodollar and usher in a dollar collapse. The prospect of this impending loss of power will be enough to crash the market. This scenario has only become more clear just in the past few days, which is why this article is being written and posted now. Markets themselves have been confused which is why they haven’t crashed yet.
Returning to our 1-year chart for the S&P500 index we can see that it has been rounding over beneath a giant Distribution Dome for many months with upside momentum steadily dwindling so that, with the index and its moving averages now increasingly tightly bunched, it is in position to break lower and drop hard or crash – and now we have the catalyst for such a development in the form of a spiking oil price, shown at the top of this chart, as a result of an increasingly catastrophic out of control situation in the Mid-East. Dip buyers here are likely to “have their heads handed to them” before long.
A viewer of the associated YouTube video made the valid point that a Head-and-Shoulders top could be forming beneath the Dome boundary. If so, the buildout of the Right Shoulder of the pattern could take from 4 to 6 weeks, as shown on the following revised version of the above chart, delaying the breakdown by the same period of time, but the ensuing drop would be worse…
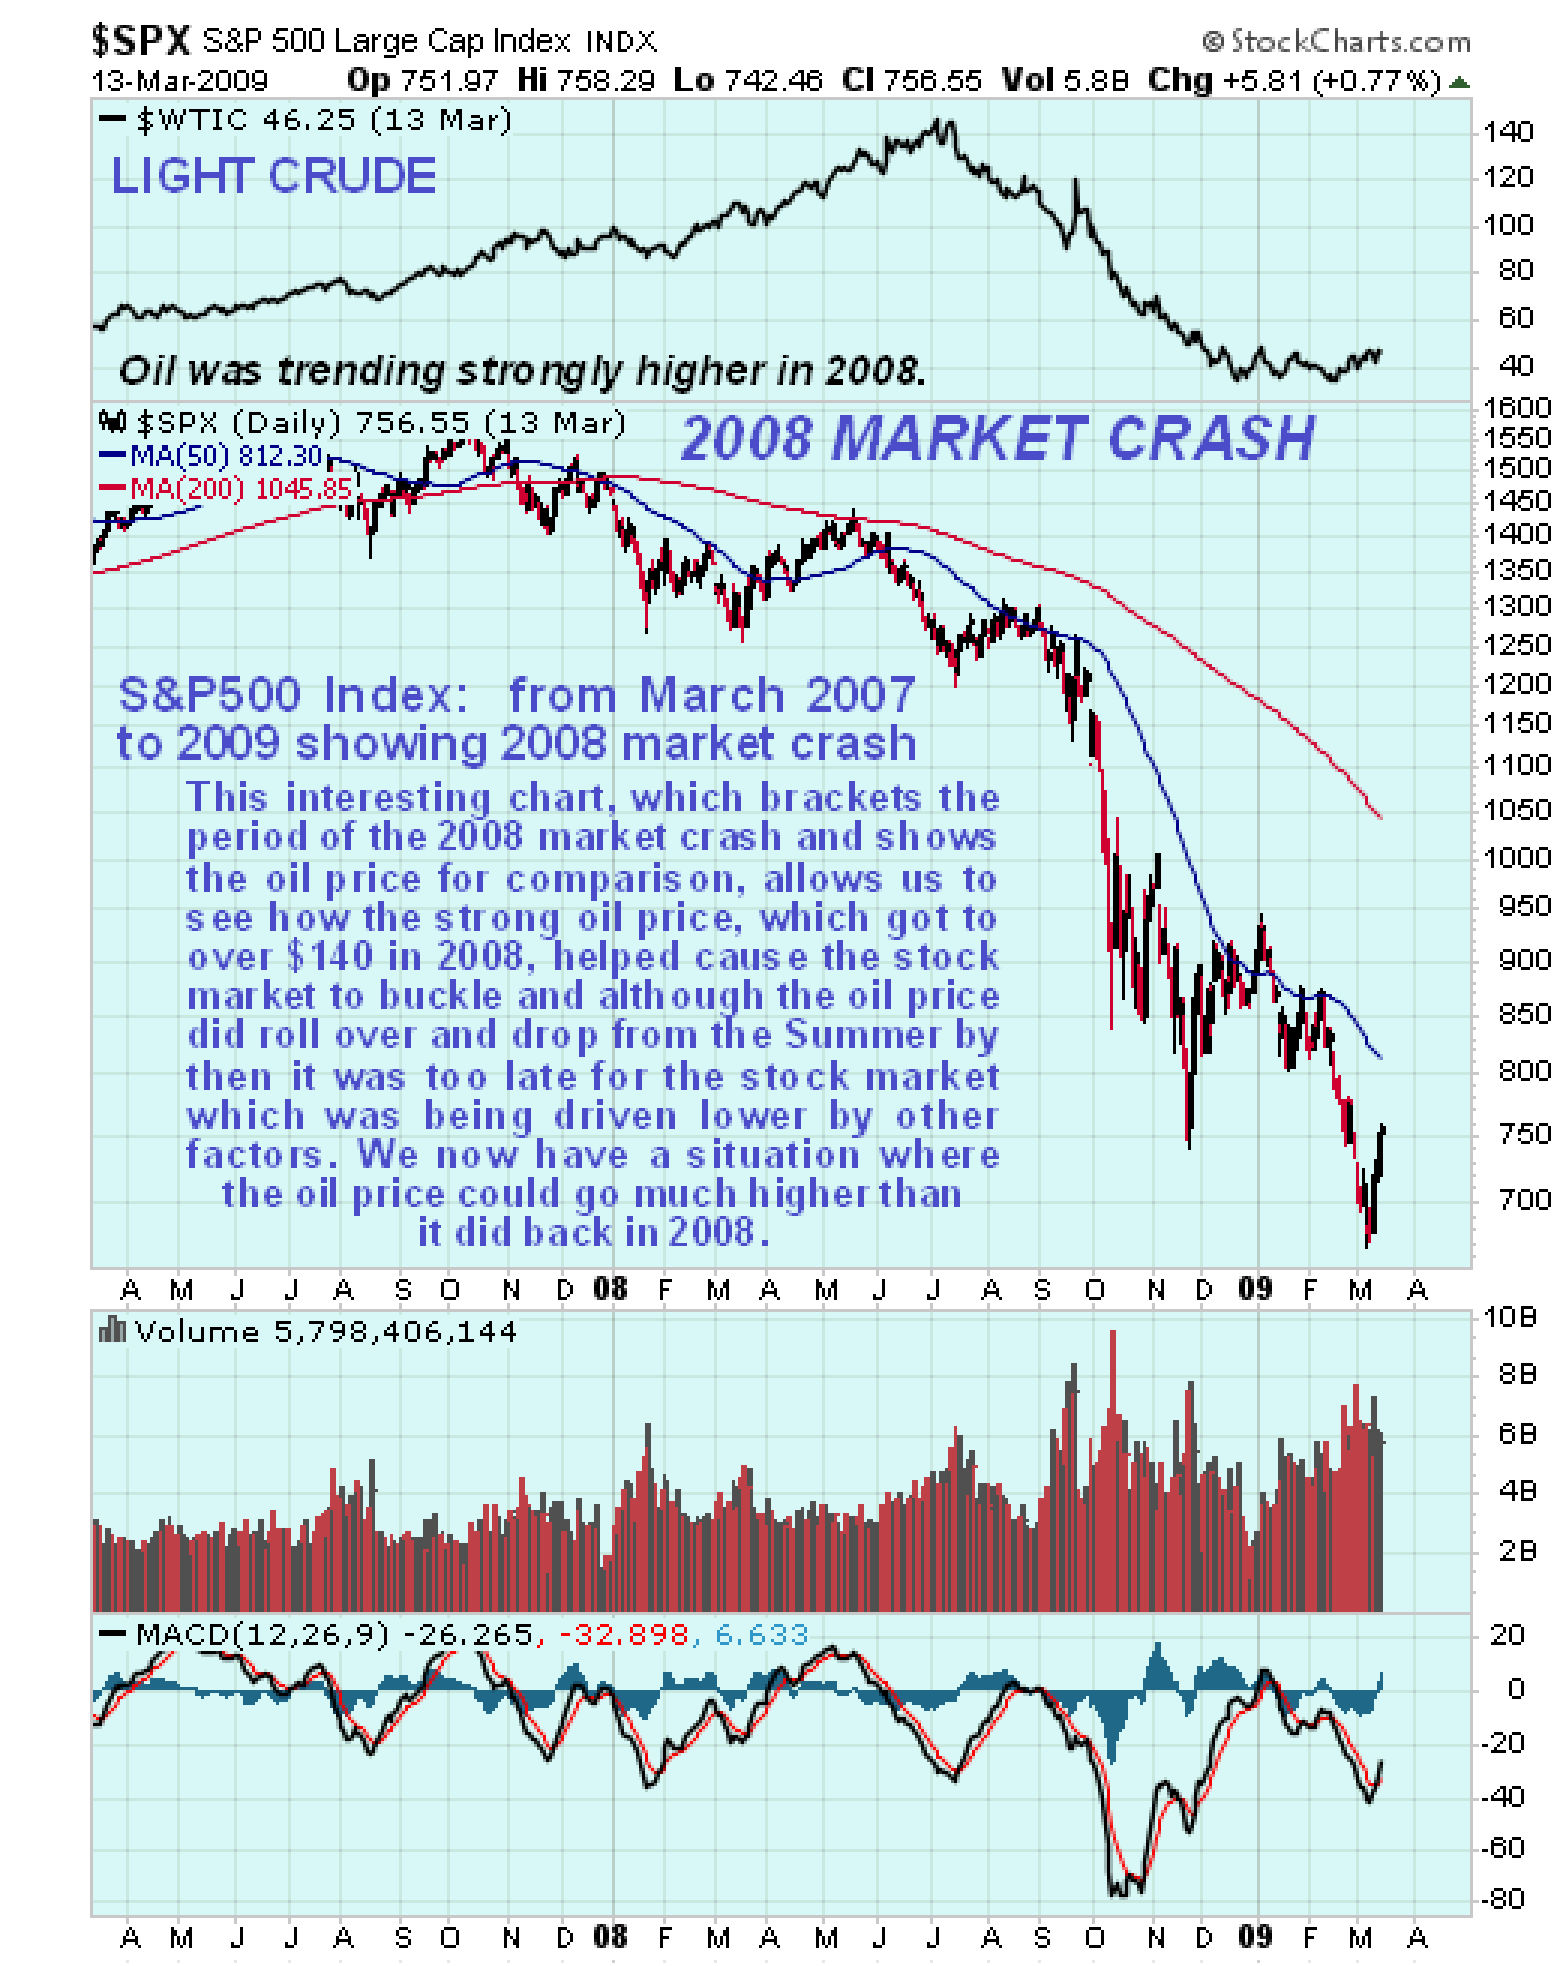
Since it looks like the sharply rising oil price will be the catalyst for the impending crash, it’s worth us comparing this chart to the 2-year chart for the period from 2007 to 2009, which brackets the 2008 market crash that was partly precipitated by the strongly rising oil price during the 1st half of 2008, when it got to over $140 a barrel…
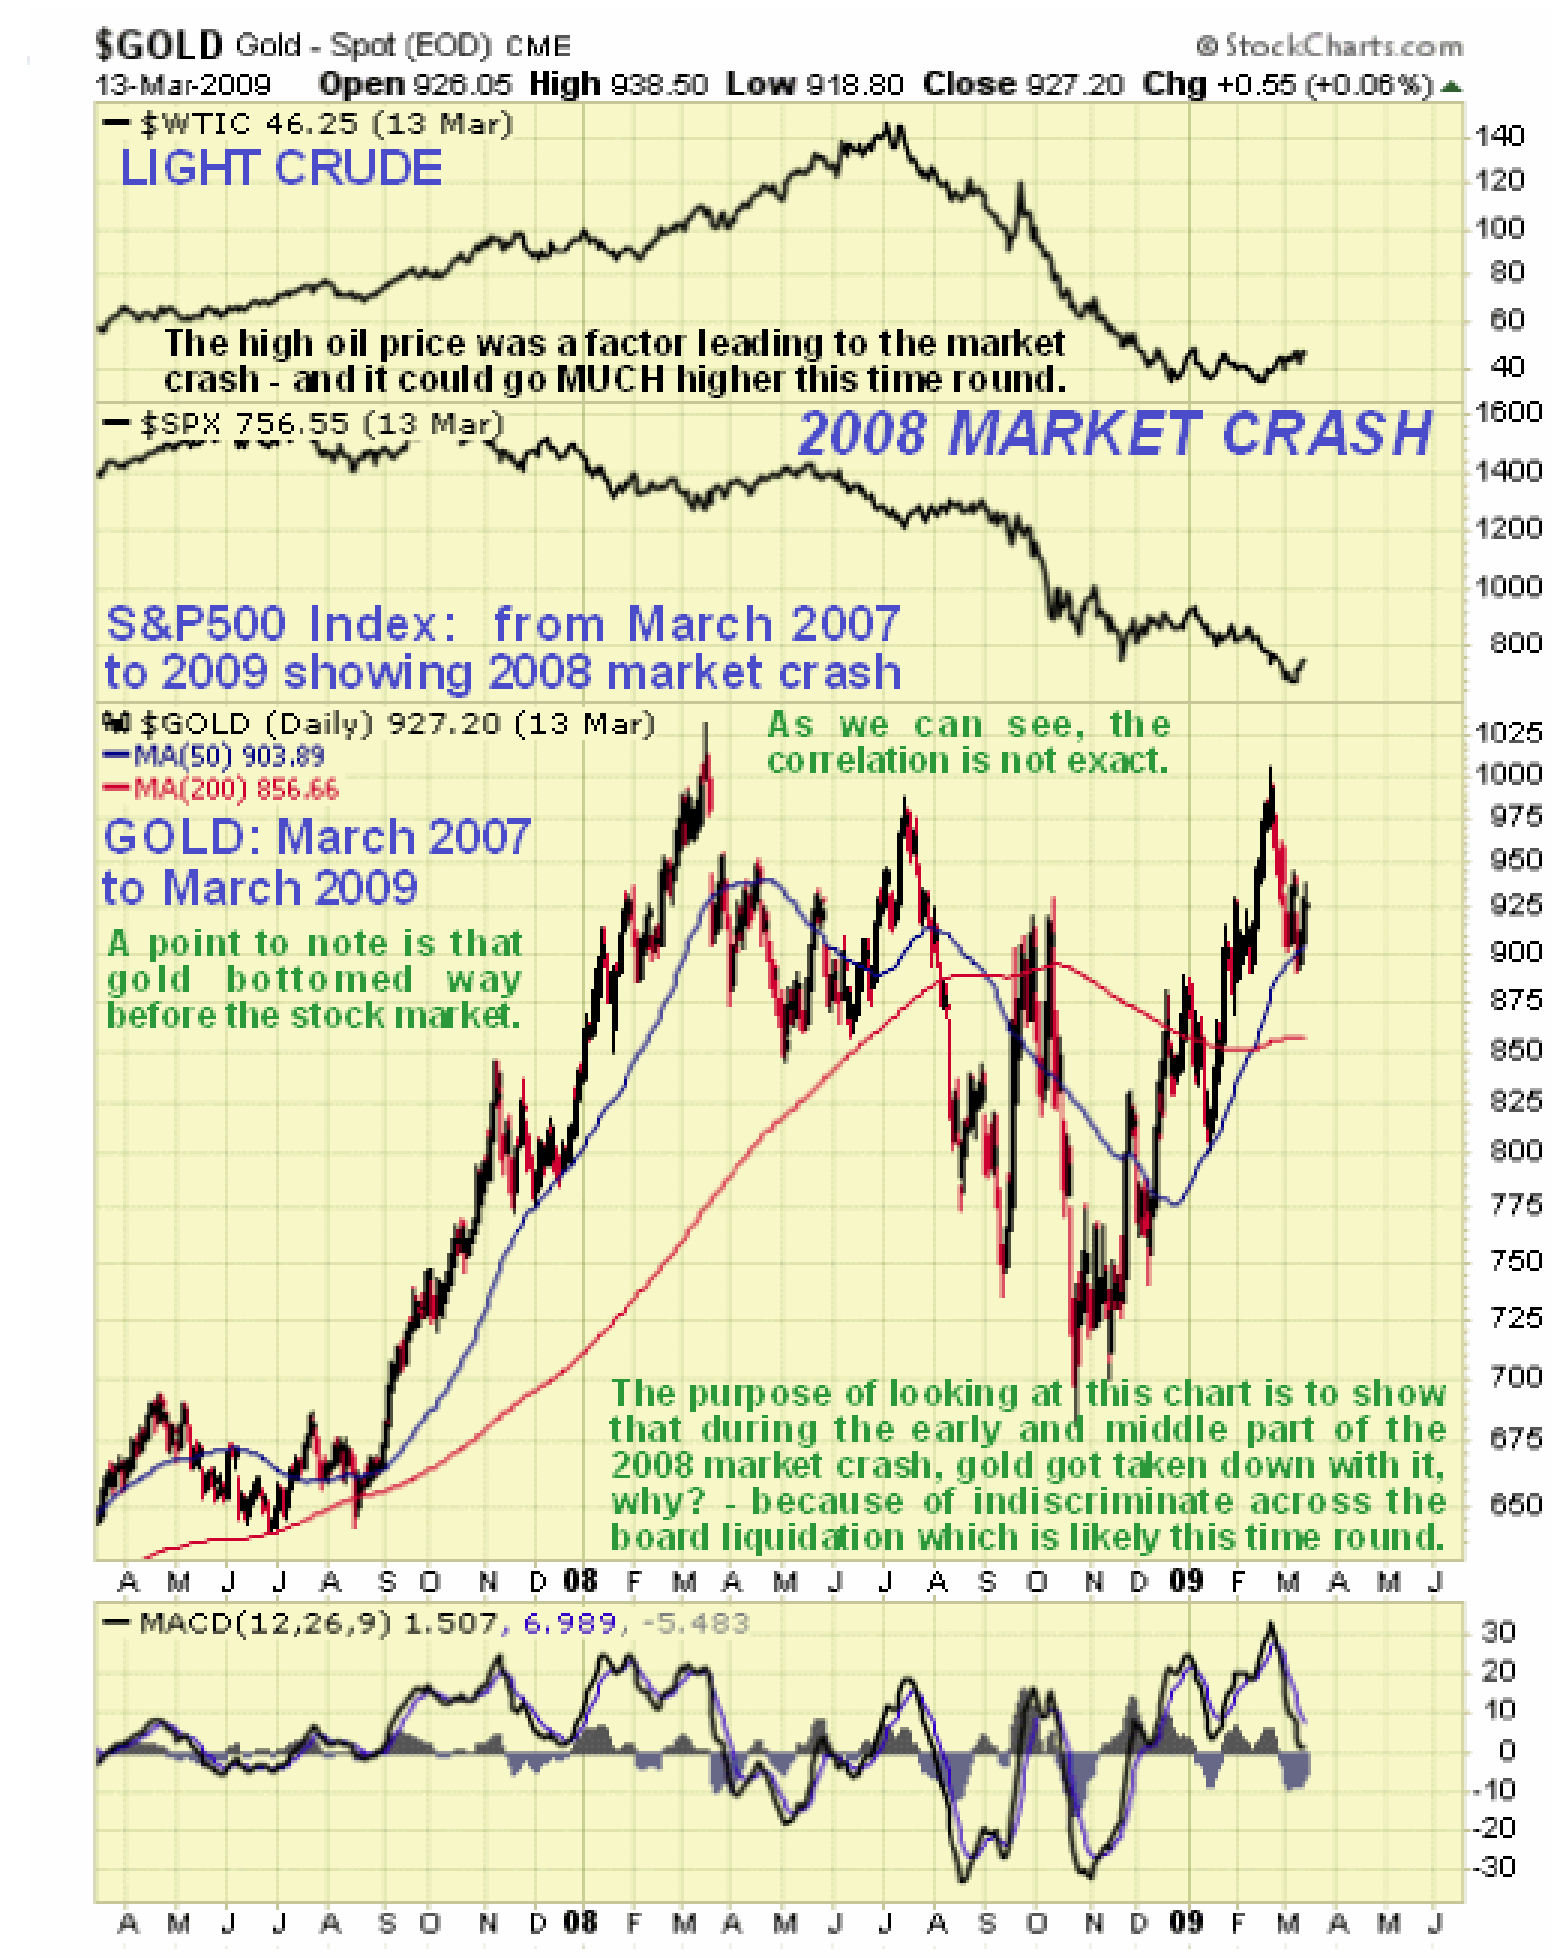
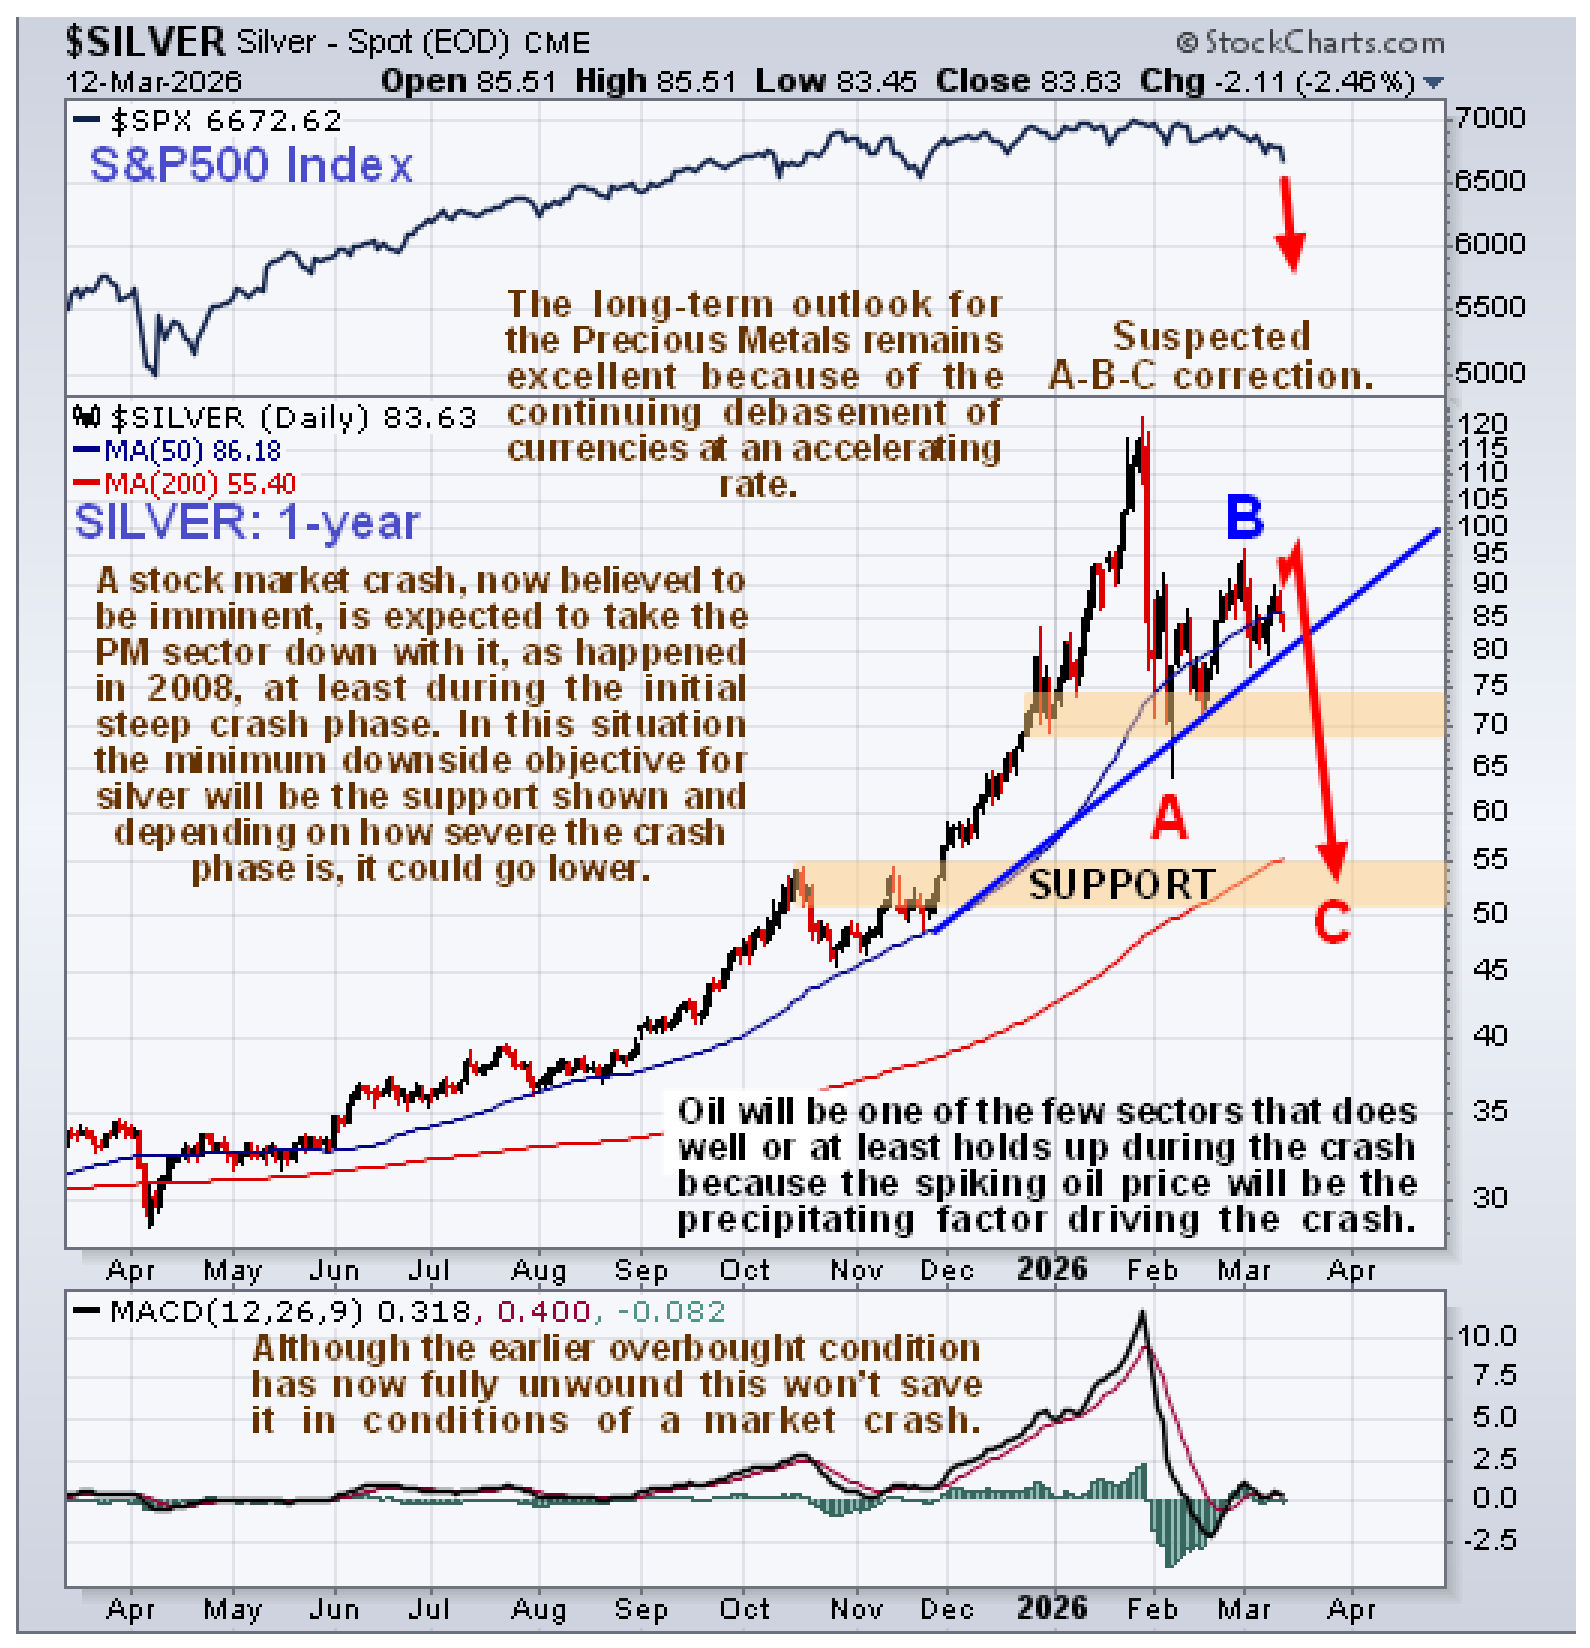
Alright, so what will be the effect of a market crash on the Precious Metals sector? – Unfortunately, despite the bullish arguments for gold and silver relating to currency destruction that remain in force, they are likely to get caught up temporarily in a maelstrom of mass liquidation, with “the baby being thrown out with the bathwater” as in 2008 – gold and silver dropped steeply then before resuming their prevailing bull market with a gusto. So we will now take a look at what happened to gold during the 2008 market crash, using a chart for the same timeframe as above, that brackets the period of the crash. Observe how, although gold dropped significantly during this period, it swiftly recovered well before the stock market bottomed and went on to reach a peak at about $1920 in 2011 so that this drop was just a pause, albeit a longer one, within an ongoing bull market, just as it will be this time round.
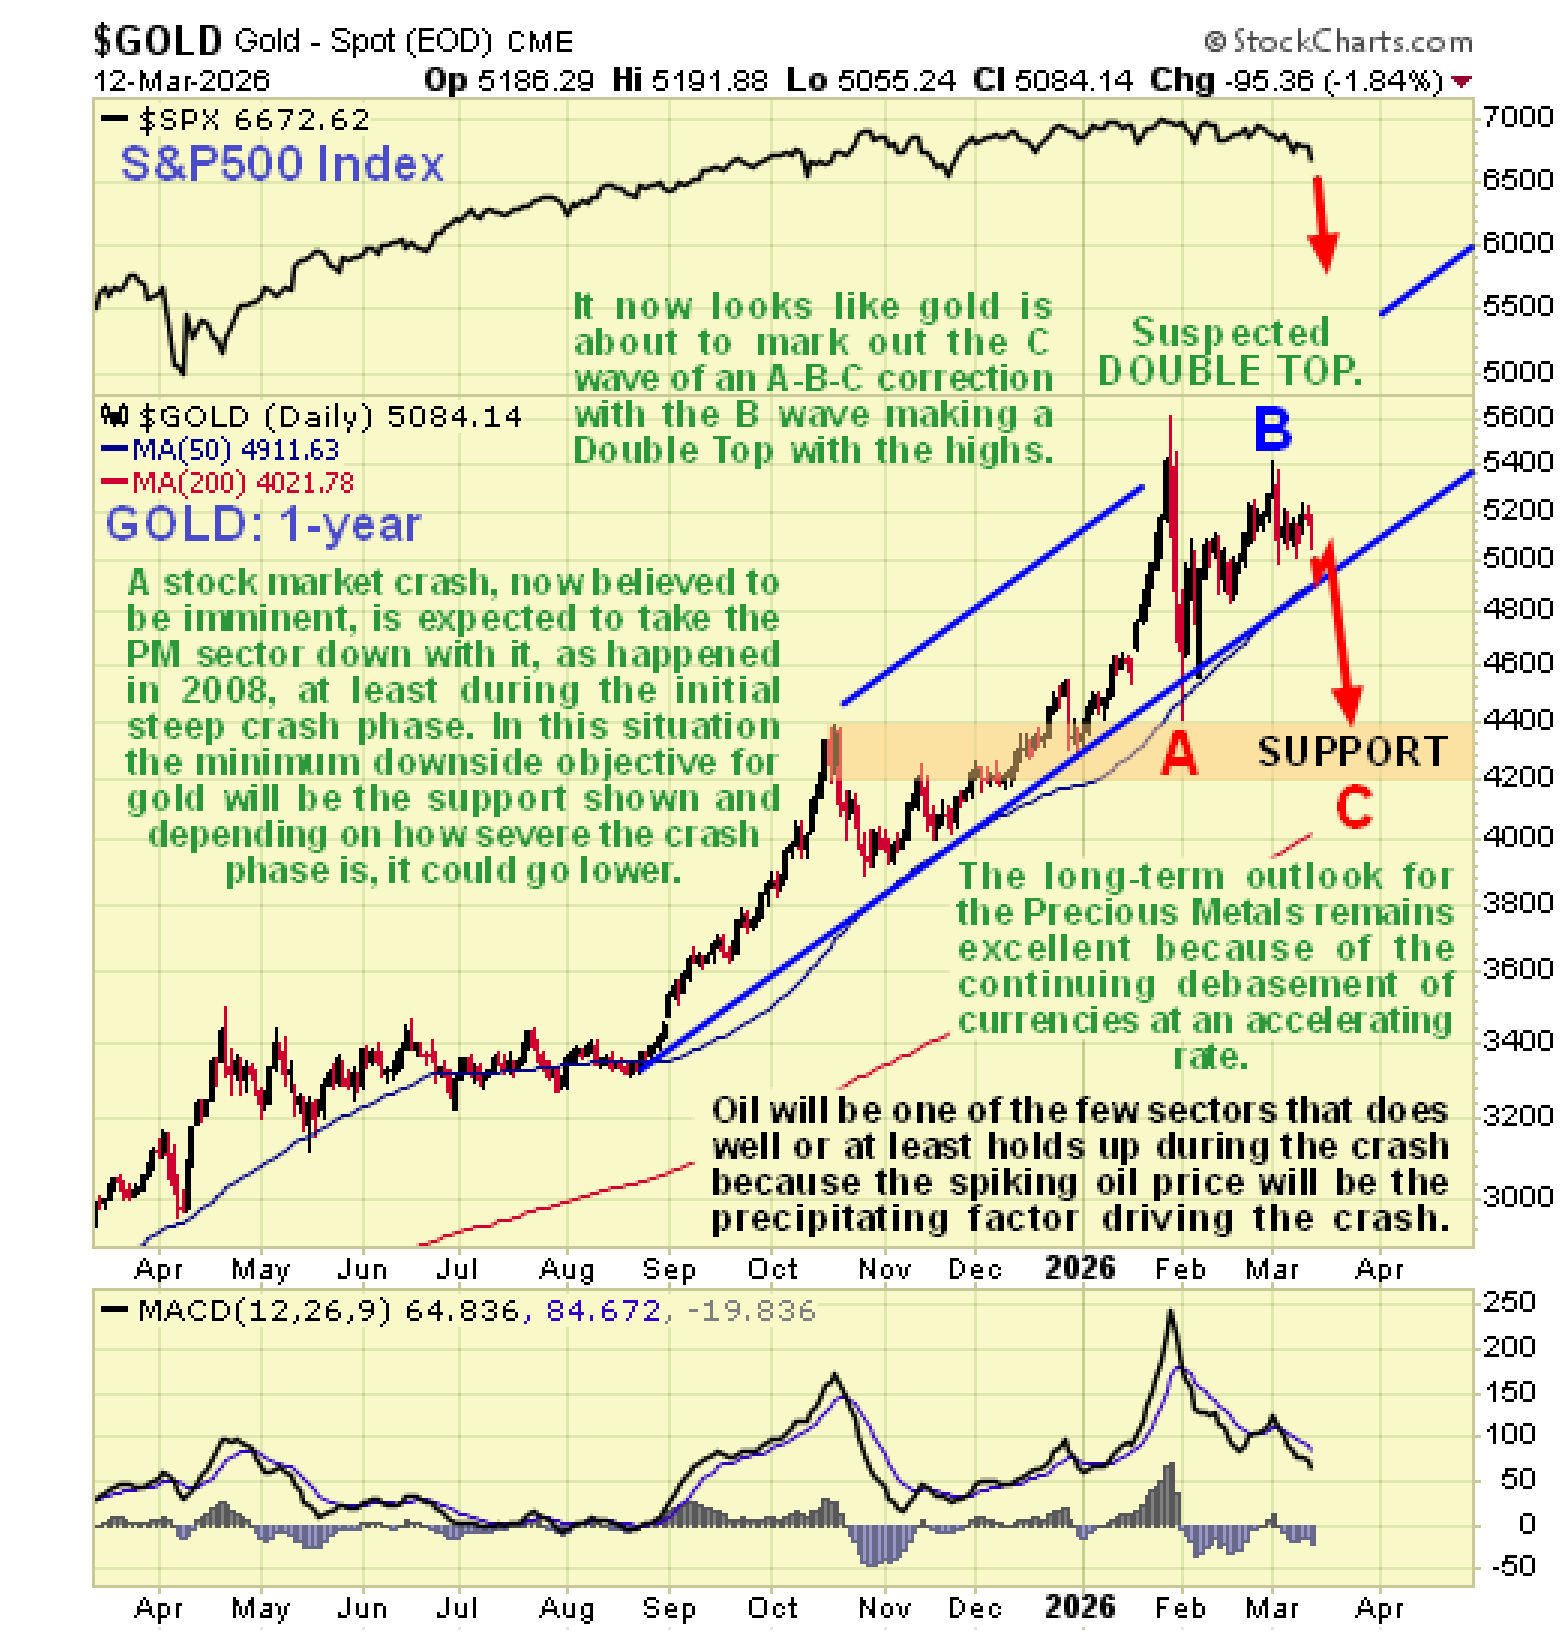
So what, therefore, looks likely to happen in the case of gold is that it drops away from the suspected Double Top now completing to mark out the C-wave of what will turn out to be a 3-wave A-B-C correction. This will break it down from the uptrend shown on its 1-year chart below and see it drop to the strong support level in the $4300 area not far above its quite steeply rising 200-day moving average and this is likely to occur against the background of a Pavlovian dollar rally, even though the long-term outlook for the dollar is grim, especially if the US gets kicked out of the Mid-East as looks likely. Iran will probably keep pounding the Gulf States until they agree to get rid of the US bases on their territory, and if they don’t then Iran has the additional persuasive tactic of blowing up their desalination plants, thus making these States uninhabitable. We should keep in mind also that if the crash is particularly severe, gold could head even lower temporarily.
It’s a similar story with silver, where, with the benefit of hindsight, we can see that it is certainly entitled to correct back further after its recent spectacular parabolic blowoff move and the C-wave of silver’s A-B-C correction is likely to take it back to the support level shown in the $50 – $55 zone before it’s run its course, which is the logical place for the correction to end as it will have then arrived at the massive support at the upper boundary of its giant Cup & Handle holding pattern that we have looked at so many times on its very long-term 45-year chart.
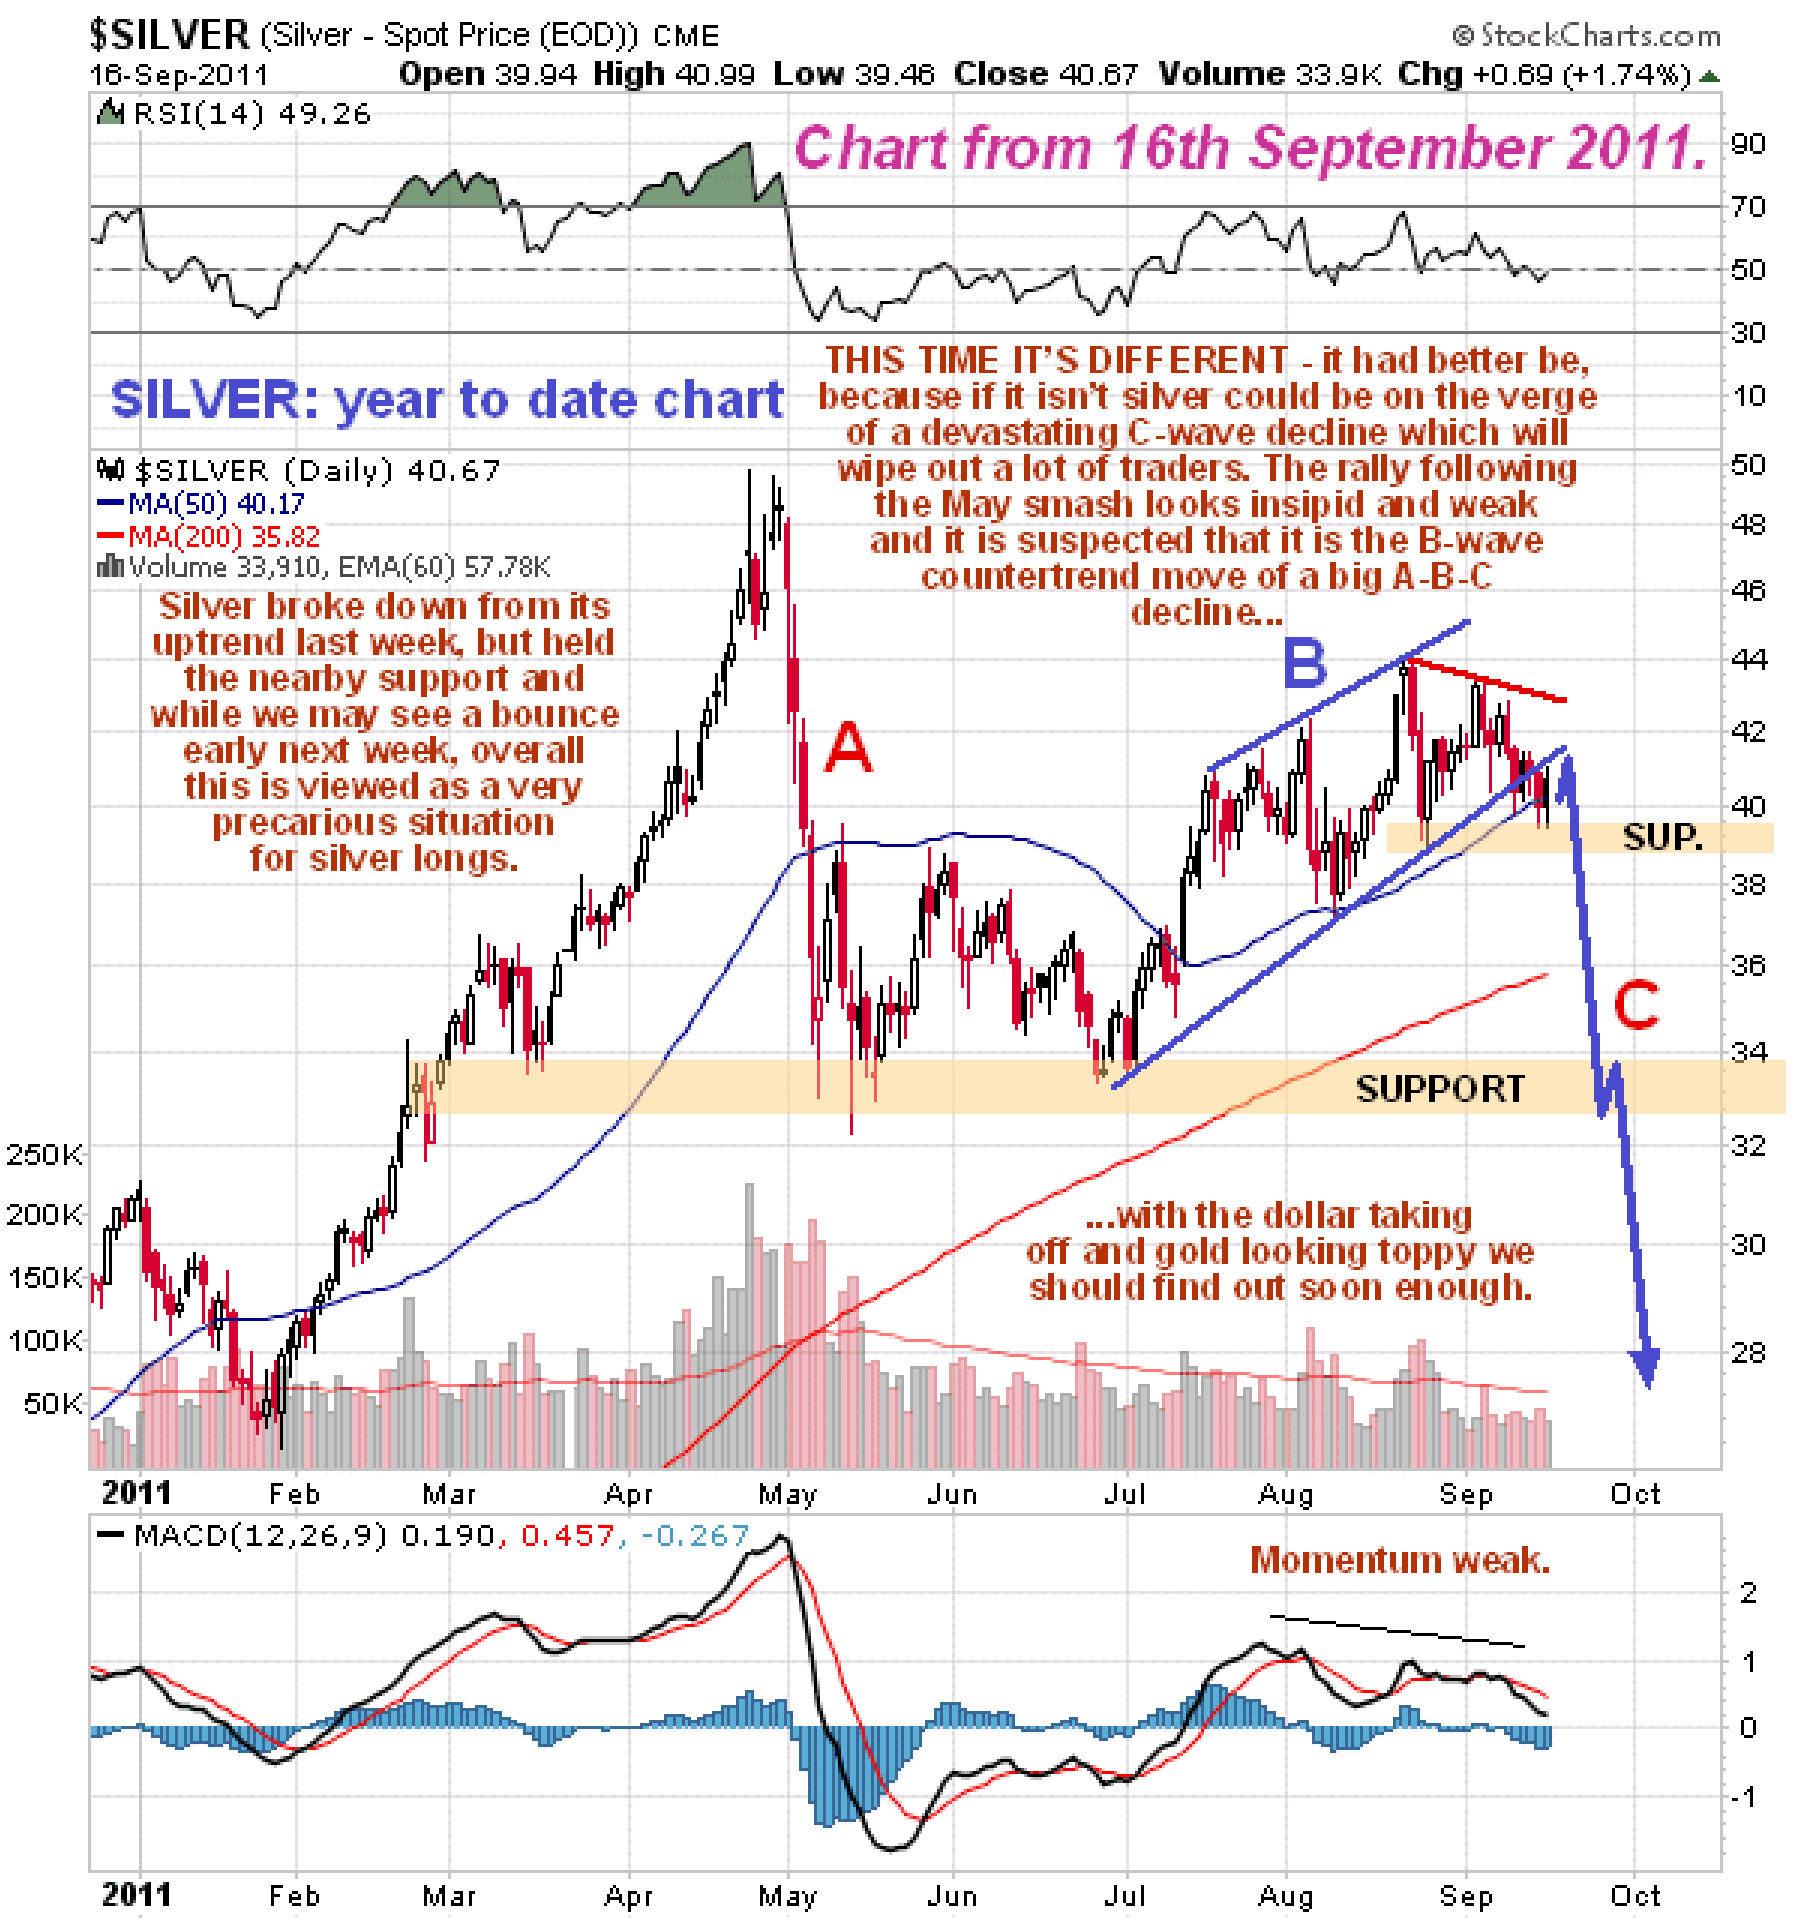
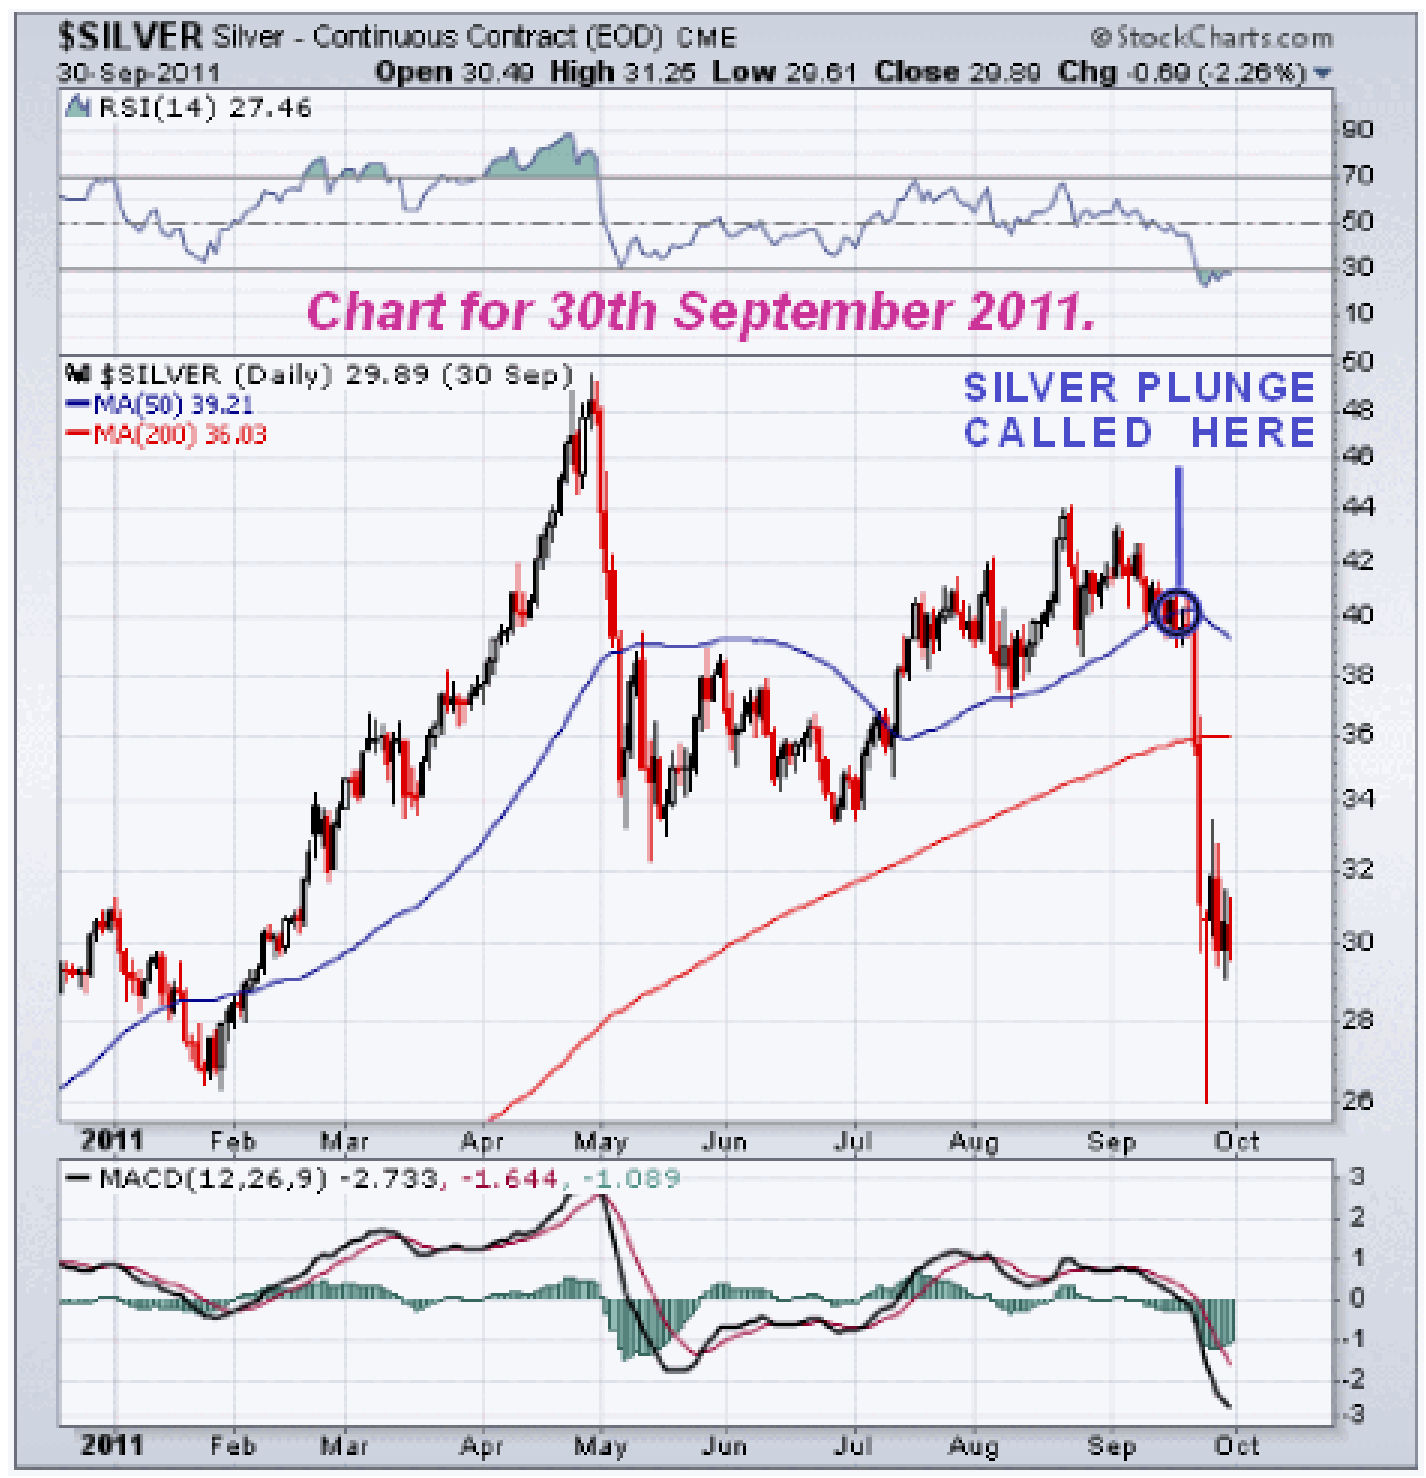
Long-term subscribers may recall that I have something of a “nose” for these C-wave smashes, having called the brutal one in silver in September of 2011 a few days before it happened…
What then are the right tactics in this situation? Bearing in mind that dealing costs these days are very low, the right tactics are thought to be to exit most or all long positions in the broad stock market and in the Precious Metals sector, a notable exception being the oil sector which could rally even if the broad market crashes if the oil price continues higher, although a market crash and the economic depression it signals would eventually take oil and oil investments lower too, as happened in later in 2008. Move the freed funds into cash (cash is a worthwhile position in a situation like this especially if we see a Pavlovian dollar rally) with an eye to buying back PM positions once the correction in them looks to have run its course, possibly at the support levels shown on our charts and in the meantime you can make money on the way down using selected inverse ETFs – it is planned to list some of them later. In addition, provided that you have the requisite experience and are set up to do it, you could buy Puts in something like SPY which could prove to be a spectacular play in this current very rare setup.
Lastly, this is a very dangerous setup that could easily lead to a “Black Monday” selloff, depending on what happens over the weekend. So if you are minded to take the action detailed above, it would probably be best to do it sometime today, as sticking around until Monday could prove costly.
End of update.
Read the full article here