

We finally received the January job numbers. They are our chart of the week. A surprise as they were higher than expected. But given all the trouble between the BLS and the president, the question is, can we believe them? They are all we’ve got.
We also had the January inflation numbers, and they were roughly as expected, down from the previous month but elevated. Makes decisions for the Fed that much harder.
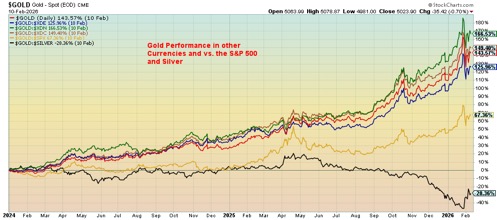
We’ve reported on the state of the markets in other currencies. We’re all so used to seeing them only in US dollars. But foreign exchange has a way of making them either better or worse in another currency. Given the weakness in the U.S. dollar over the past year, generally, the S&P 500 in other currencies has outperformed the S&P 500 in U.S. dollars. We also stated gold in other currencies. Same story. Gold in currencies that have deteriorated against the U.S. dollar has performed better. A hedge against currency depreciation. But when we looked at them in terms of silver, they all fell because of silver’s outperformance vis-à-vis the S&P 500 and gold. It shows them as down against silver.
The stock markets continue to demonstrate topping action. They haven’t broken yet. The NASDAQ is leading thanks to the MAG7. Weakness will persist unless we regroup and move once again to new highs. Gold and silver continue to consolidate following the recent nasty decline. Volatility is now prevalent in gold and silver with some sharp down days and sharp up days. We can’t rule out the possibility of new lows or a final low until March. However, the long-term trend is intact, and the reasons for the strong performance of gold and silver have not gone away. OceanaGold Corporation, for example, reported higher revenue, reduced debt, and year-over-year increased net profit, pays a dividend, and is held in the Enriched Capital Conservative Growth Strategy.*
Have a great week!
DC
* Reference to the Enriched Capital Conservative Growth Strategy and its investments, celebrating an 8 -year history of 152.91% growth (annual 12.30%), is added by Margaret Samuel, President, CEO and Portfolio Manager of Enriched Investing Incorporated, who can be reached at 416-203-3028 or [email protected] This information should not be construed as an offer, or a solicitation of an offer or sale of any security. Past performance does not guarantee future returns
“Letting your emotions override your plan or system is the biggest cause of failure.”
—J. Welles Wilder Jr., American mechanical engineer, real estate developer, best known for work in technical analysis and key development indicators such as Average True Range, RSI, Average Directional Indicator, Parabolic SAR; 1935–2021
“Under capitalism man exploits man: under communism the reverse is true.”
—Polish proverb but also attributed to John Kenneth Galbraith, Canadian-American economist, diplomat, public official, intellectual, author, best known for The Affluent Society (1958) plus other books, served in several Democrat administrations; 1908–2006
“Whenever you see a successful business, someone once made a courageous decision.”
—Peter Drucker, Austrian-American management consultant, educator, author, known for contributions to The Harvard Business Review, The Atlantic, and The Economist, books include The Effective Executive (1966) plus several others; 1909–2005
Source: www.stockcharts.com
We’ve often noted that for a rise in the S&P 500, reported in U.S. dollars, the result is not necessarily the same in other currencies. This chart tells us that. Since the start of 2024, the S&P 500 is up 45.4% (close is February 11, 2026). But that’s in U.S. dollars. The Japanese might be more elated as in Japanese yen the S&P 500 is up 58.3%. In Canadian dollars, the S&P 500 is up 49.5%. Both outpaced the rise in US dollars. For euros, the S&P 500 is up 35.3%, reflecting a stronger euro vis-à-vis the U.S. dollar.
So, what gives? In terms of gold, the S&P 500 has lost 46.3% while in silver terms it’s down 57.2%. That tells us that owning gold and silver was a far better bet than owning the S&P 500. We presume that it also includes the MAG7, which with a few others makes up some 40% of the S&P 500.
Source: www.stockcharts.com
Moving over to gold, we expect some similar results. Gold is up 143.6% since the start of 2024. In Japanese yen terms it has soared 166.5%, thanks to a weak yen. In terms of the Canadian dollar, it is up 149.4%. Both outpaced gold in U.S. dollars. In euro terms gold is up 126.0%, a bit weaker than in U.S. dollars, reflecting a stronger euro. But in relation to silver, silver has been the clear winner as gold has fallen 28.4% in silver terms.
Foreign exchange is important. The overall gain for gold (or the S&P 500) in a host of other currencies reflects the weakness of the U.S. dollar. As we’ve often noted, gold is a hedge against currency depreciation. And, given that both the yen and Canadian dollar have deteriorated vs. the U.S. dollar, that was an advantage if you held gold over yen or Canadian dollars. Other currencies reflect the same.
Chart of the Week
US Job Numbers
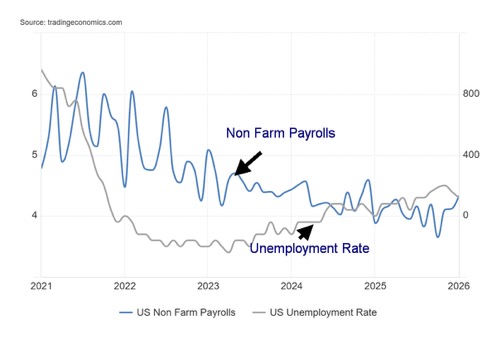
Source: www.tradingeconomics.com, www.bls.gov
To believe or not to believe. That is the question. The January labour numbers came out somewhat delayed due to yet another government shutdown (a partial one this time). And our report is not that timely in that the numbers came out mid-week rather than on Friday as usual. Okay, waiting a few days is better than never getting them at all. The numbers were gangbusters. Or at least that’s what was reported and we are expected to believe it.
Nonfarm payrolls for January 2026 came in up 130,000, above the consensus 70,000 and downwardly revised December nonfarm of 48,000. The number of jobs over the past four months is up 79,000 after a disastrous October 2025. For all of 2025 the U.S. economy added just 181,000 jobs, well down from earlier estimates of 584,000. Suddenly, one month almost equals the gains of all of 2025.
The unemployment rate (U3) fell to 4.3% from 4.4% while the U6 unemployment (total unemployed, plus all persons marginally attached to the labour force, plus total employed part-time for economic reasons, as a percent of the civilian labour force plus all persons marginally attached to the labour force) fell to 8.0% from 8.4%. Earnings rose as well. Average hourly earnings were up 0.4%, above the expected 0.3%. This metric is important as it gives clues about consumer spending.
Wow! Great report! But can it be believed, given a few months back Trump fired the head of the Bureau of Labour Statistics (BLS) because he was ticked over a lousy report? The question now is, how independent is the BLS? We have to believe the report because these are the only numbers we’ve got. As we noted before, the ADP employment numbers were worse than expected and Challenger Job Cuts were higher than expected. The logical conclusion from this was the nonfarm payrolls were not expected to be gangbusters. Okay, that’s relevant because all signs pointed to a declining job market. Although this is nowhere near the levels reported through 2024 when nonfarm was declining but not down to today’s levels.
Not surprisingly, the number unemployed fell by 141,000. The population level rose 166,000 despite deportations and other disruptions. The civilian labour force rose 387,000. The not in labour force fell 143,000. This indicates that many people reentered the labour market. The labour force participation rate rose to 62.5% from 62.4% while the employment population ratio also rose to 59.8% from 59.7%. The employment level rose a whopping 523,000 while full-time employment jumped 582,000 and part-time employment was up 31,000. That these numbers never seem to be reconciled with nonfarm payrolls is beside the point. Two different areas and reports highlight the difference between the establishment survey and the household survey. The establishment survey reports on nonfarm payrolls. The household survey reports on the rest.
The number of people unemployed for 27 weeks or longer rose 9,000, but the average weeks unemployed fell to 23.9 weeks from 24.4 weeks while the median weeks unemployed dropped to 10.1 weeks from 11.1 weeks. All in all, this was a good report. The stock market rose, bond yields rose, the US$ Index was steady, and, surprisingly, gold and silver also rose. Normally this would shake gold and silver. Does gold and silver smell a rat?
So, what to make of all of this? Job gains were in health care, social assistance, and construction. Job losses were in government. Two reports say that the labour market is weakening, and this report says it’s strengthening. But the two reports saying the labour market is weakening are not government agencies. Could they all be seasonal jobs, especially given the snowstorms that have plagued the U.S. and Canada? Will these jobs disappear over the next few months? What happened to disruptions due to deportations? Most of those impacted were employed, often full-time. Did they suddenly find replacements?
Going forward, the February jobs report should be interesting. As well, revisions are not unusual going forward and often those revisions are downward as overestimates are found. Creating these numbers is a science. No, they don’t go every month to business, government, etc. and do a head count. Surveys are done and the numbers are statistically extrapolated. Also, how these surveys take place can impact the numbers. Apparently, there have been declining response rates.
These are the numbers we’ve got so we must go with them. But maybe the response from the gold and silver market is the decider. If bond yields rise, gold and silver usually decline. Not this time. It does leave the Fed in a quandary. The president wants lower interest rates. The jobs report says steady or even higher interest rates. The bond market says rates should be higher. Another tussle is coming.
Inflation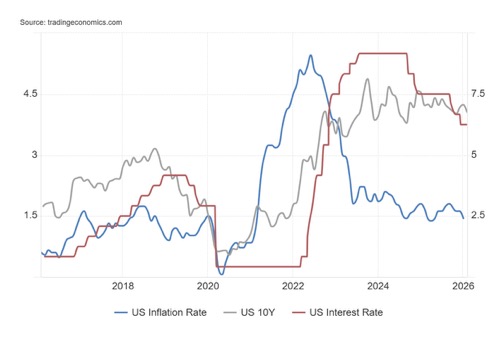
The January inflation numbers came out and they were somewhat better than expected. However, they remain above the Fed’s target rate of 2%. Inflation also remains below the Fed rate and the U.S. 10-year Treasury note, giving us a positive return. January’s inflation came in at 2.4%, below the previous 2.7%. The core inflation rate (ex-food and energy) came in at 2.5%, also below December’s 2.6%. Both were generally around consensus, so no surprises. Still, it will continue to leave the Fed in a quandary as to what to do. The lean here is to do nothing, which of course is not what the president wants; his goal is for sharply lower interest rates. Kevin Warsh, the new Fed Chair pick needs to be confirmed by the Senate. His appointment is not a given. If he was to be rejected, that would set off more battles with the president. The market may also react negatively.
Two things come to mind about the January inflation numbers. First, these numbers reflect the negative impact of the government shutdown. That would put downward pressure on the rate. Second, we’ve learned a lot of companies have sucked up the tariffs. However, that may be coming to an end. The result is that inflation may tick upwards once again.
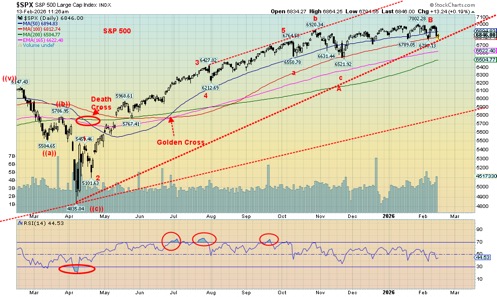
Stocks
Source: www.stockcharts.com
Stocks are barely clinging to their uptrend. But so far that line continues to hold. We are seeing the same elsewhere. Uptrend intact but…it wouldn’t take much to bust it. Weakest thus far is the NASDAQ as the MAG7 stocks continue to fall. Over the past week six of the seven MAG7 finished down. The patterns are appearing as a big topping pattern. We use 6,700 and 6,500 as our breakdown points. As no surprise, the 200-DMA is at 6,500. Volume has picked up a little, particularly on the downside. Add in that volume picked up even as we went nowhere. That tells us that the next move for this market is most likely to the downside. If there were some interesting strengths it was that the S&P 500 Equal Weight Index made new all-time highs this past week and finished the week up slightly. The S&P 500 did not have the same luck. February is normally a weak month and so far we haven’t been disappointed.
Gold and Silver
Source: www.stockcharts.com
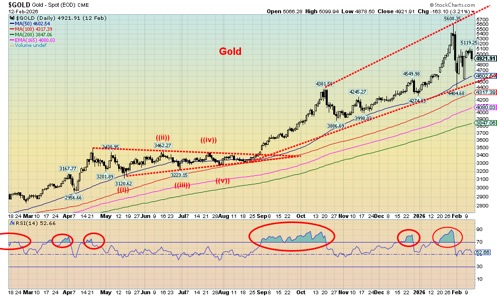
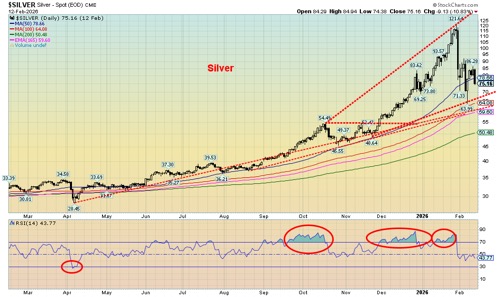
Both gold and silver continue to whip around in a volatile manner. We’d say that’s not normal but then the rise was quite dramatic so a dramatic correction should not be a surprise. The long-term trend remains up, but before we resume the bull market a test lower still can’t be ruled out. Our expectations are that this won’t bottom until March sometime. Given the huge up move in silver once it broke that the long-time high of $50, we could see a retest of the $50 zone. Naturally, new highs would end any discussion of a test lower. The reasons for the rally in gold and silver have not gone away. Geopolitical tensions, domestic political chaos, and sticky inflation are among the reasons it’s rising in the first place. Gold is the safe haven. Not Bitcoin, which is now down 45% from that high last October 2025. In previous declines a drop of 80% was not unusual.
Gold has good support down to $4,500 but $4,300 can’t be ruled out. We’d like to see that hold. We don’t want to see gold break under $3,800 as that would suggest that the bull is over. The RSI is fairly neutral here, in the 50s. Silver’s correction has been far more dramatic so the dramatic drop shouldn’t be a surprise. So far, we found support around $64; however, we note that was down 48% from the high. Silver, right now, is in a bear market. And with gold down around 22% at the recent lows, gold is also arguably in a bear market. Gold needs to break over $5,300 to suggest that the low is in and new highs lie ahead. For silver it’s $108, although regaining above $90 would be encouraging. A bear for gold and silver shouldn’t have been a surprise given the steep rise. This correction will go a long way to work off the excess exuberance as weak hands exit.
Source: www.stockcharts.com
Source: www.visualcapitalist.com, www.globalinvestmentletter.com
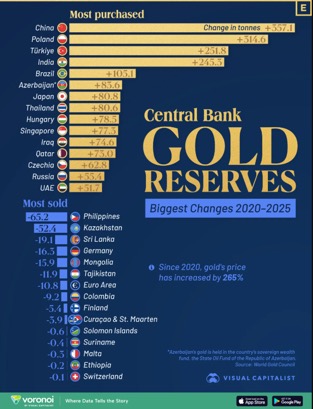
Central banks have been adding to their gold reserves over the past 5 years. Maybe this shouldn’t be surprising. Central banks are not adding gold as a speculation. They add it to strengthen their balance sheets and to move away from U.S. securities due to conflict with the U.S. and nervousness over the U.S.’s massive debt the highest in the world. This has been particularly true of China. China’s holdings of U.S. securities have fallen $68 billion over the past year even as total foreign holdings of U.S. treasuries has gone up $632 billion. Others such as Japan, the U.K. and even Canada have picked up the slack. A reminder that Canada no longer has any gold holdings having sold them off in 2016. It’s a decision they may regret as the U.S. dollar falls and bond yields remain high with price pressure to the downside despite this past week’s price rise, yield down.
None of this suggests the U.S. dollar is about to collapse. It’s not. But it does signal that confidence in the U.S. dollar is waning
Remember, gold does not pay a yield, there are storage costs. Yet still the central banks have been accumulating gold. If central banks are buying, shouldn’t you?
Markets and trends follow
Markets and Trends
|
|
|
|
% Gains (Losses) Trends |
|
||||
|
|
Close Dec 31/25 |
Close Feb 13/26 |
Week |
YTD |
Daily (Short Term) |
Weekly (Intermediate) |
Monthly (Long Term) |
|
|
|
|
|
|
|
|
|
||
|
S&P 500 |
6,845.50 |
6,836.17 |
(1.39)% |
(0.14) |
up |
up |
up |
|
|
Dow Jones Industrials |
48,063.29 |
49,500.33 |
(1.2)% |
3.0% |
up |
up |
up |
|
|
Dow Jones Transport |
17,357.19 |
19,343.92 |
(2.8)% |
11.4% |
up |
up |
up |
|
|
NASDAQ |
23,241.99 |
22,546.67 |
(2.1)% |
(3.0)% |
up |
up |
up |
|
|
S&P/TSX Composite |
31,712.76 |
33,073.71 |
1.9% |
4.3% |
up |
up |
up |
|
|
S&P/TSX Venture (CDNX) |
987.74 |
991.99 |
(2.3)% |
(0.43)% |
up |
up |
up |
|
|
S&P 600 (small) |
1,467.76 |
1,597.05 (new highs) * |
(0.8)% |
8.8% |
up |
up |
up |
|
|
ACWX MSCI World x US |
67.18 |
73.25 (new highs) * |
1.7% |
9.0% |
up |
up |
up |
|
|
Bitcoin |
87,576.98 |
68,821.67 |
(1.8)% |
(21.4)% |
down |
down |
neutral |
|
|
|
|
|
|
|
|
|
|
|
|
Gold Mining Stock Indices |
|
|
|
|
|
|
|
|
|
Gold Bugs Index (HUI) |
701.49 |
871.32 |
8.0% |
24.2% |
up |
up |
up |
|
|
TSX Gold Index (TGD) |
817.76 |
991.79 |
7.4% |
21.3% |
up |
up |
up |
|
|
|
|
|
|
|
|
|
|
|
|
% |
|
|
|
|
|
|
|
|
|
U.S. 10-Year Treasury Bond yield |
4.17% |
4.05% |
(3.8)% |
(2.9)% |
|
|
|
|
|
Cdn. 10-Year Bond CGB yield |
3.44% |
3.26% |
(4.1)% |
(5.2)% |
|
|
|
|
|
Recession Watch Spreads |
|
|
|
|
|
|
|
|
|
U.S. 2-year 10-year Treasury spread |
0.69% |
0.63% |
(11.3)% |
(8.7)% |
|
|
|
|
|
Cdn 2-year 10-year CGB spread |
0.85% |
0.78% |
(8.2)% |
(8.2)% |
|
|
|
|
|
|
|
|
|
|
|
|
|
|
|
Currencies |
|
|
|
|
|
|
|
|
|
US$ Index |
98.26 |
96.88 |
(0.8)% |
(1.4)% |
down |
down |
down |
|
|
Canadian $ |
72.87 |
0.7343 |
0.3% |
0.8% |
up |
up |
neutral |
|
|
Euro |
117.48 |
118.68 |
0.4% |
1.2% |
up |
up |
up |
|
|
Swiss Franc |
126.21 |
130.27 |
1.0% |
3.2% |
up |
up |
up |
|
|
British Pound |
134.78 |
136.51 |
0.2% |
1.3% |
up |
up |
up |
|
|
Japanese Yen |
63.83 |
65.47 |
2.9% |
2.6% |
up |
down |
down |
|
|
|
|
|
|
|
|
|
|
|
|
|
|
|
|
|
|
|
|
|
|
Precious Metals |
|
|
|
|
|
|
|
|
|
Gold |
4,311.97 |
5,041.72 |
1.8% |
16.9% |
up |
up |
up |
|
|
Silver |
71.16 |
77.19 |
(0.4)% |
8.5% |
down (weak) |
up |
up |
|
|
Platinum |
124.81 |
2,067.70 |
(1.4)% |
1.0% |
down (weak) |
up |
up |
|
|
|
|
|
|
|
|
|
|
|
|
Base Metals |
|
|
|
|
|
|
|
|
|
Palladium |
1,619.50 |
1,722.00 |
0.4% |
6.3% |
down |
up |
up |
|
|
Copper |
5.64 |
5.79 |
(1.5)% |
2.7% |
neutral |
up |
up |
|
|
|
|
|
|
|
|
|
|
|
|
Energy |
|
|
|
|
|
|
|
|
|
WTI Oil |
57.44 |
62.81 |
(1.1)% |
9.2% |
up |
up (weak) |
down |
|
|
Nat Gas |
3.71 |
3.20 |
(6.2)% |
(13.8)% |
down |
down |
up |
|
Source: www.stockcharts.com
* New All-Time Highs
Note: For an explanation of the trends, see the glossary at the end of this article.
New highs/lows refer to new 52-week highs/lows and, in some cases, all-time highs.
Copyright David Chapman 2026
GLOSSARY
Trends
Daily – Short-term trend (For swing traders)
Weekly – Intermediate-term trend (For long-term trend followers)
Monthly – Long-term secular trend (For long-term trend followers)
Up – The trend is up.
Down – The trend is down
Neutral – Indicators are mostly neutral. A trend change might be in the offing.
Weak – The trend is still up or down but it is weakening. It is also a sign that the trend might change.
Topping – Indicators are suggesting that while the trend remains up there are considerable signs that suggest that the market is topping.
Bottoming – Indicators are suggesting that while the trend is down there are considerable signs that suggest that the market is bottoming.
Disclaimer
David Chapman is not a registered advisory service and is not an exempt market dealer (EMD) nor a licensed financial advisor. He does not and cannot give individualised market advice. David Chapman has worked in the financial industry for over 40 years including large financial corporations, banks, and investment dealers. The information in this newsletter is intended only for informational and educational purposes. It should not be construed as an offer, a solicitation of an offer or sale of any security. Every effort is made to provide accurate and complete information. However, we cannot guarantee that there will be no errors. We make no claims, promises or guarantees about the accuracy, completeness, or adequacy of the contents of this commentary and expressly disclaim liability for errors and omissions in the contents of this commentary. David Chapman will always use his best efforts to ensure the accuracy and timeliness of all information. The reader assumes all risk when trading in securities and David Chapman advises consulting a licensed professional financial advisor or portfolio manager such as Enriched Investing Incorporated before proceeding with any trade or idea presented in this newsletter. David Chapman may own shares in companies mentioned in this newsletter. Before making an investment, prospective investors should review each security’s offering documents which summarize the objectives, fees, expenses and associated risks. Although Artificial Intelligence (AI) may be deployed from time to time, AI output is monitored and adjusted, if necessary, for accuracy. David Chapman shares his ideas and opinions for informational and educational purposes only and expects the reader to perform due diligence before considering a position in any security. That includes consulting with your own licensed professional financial advisor such as Enriched Investing Incorporated. Performance is not guaranteed, values change frequently, and past performance may not be repeated.
Read the full article here