

Gold:
The Captain’s weekly gold chart.
 The short-term daily chart.
Analysis:
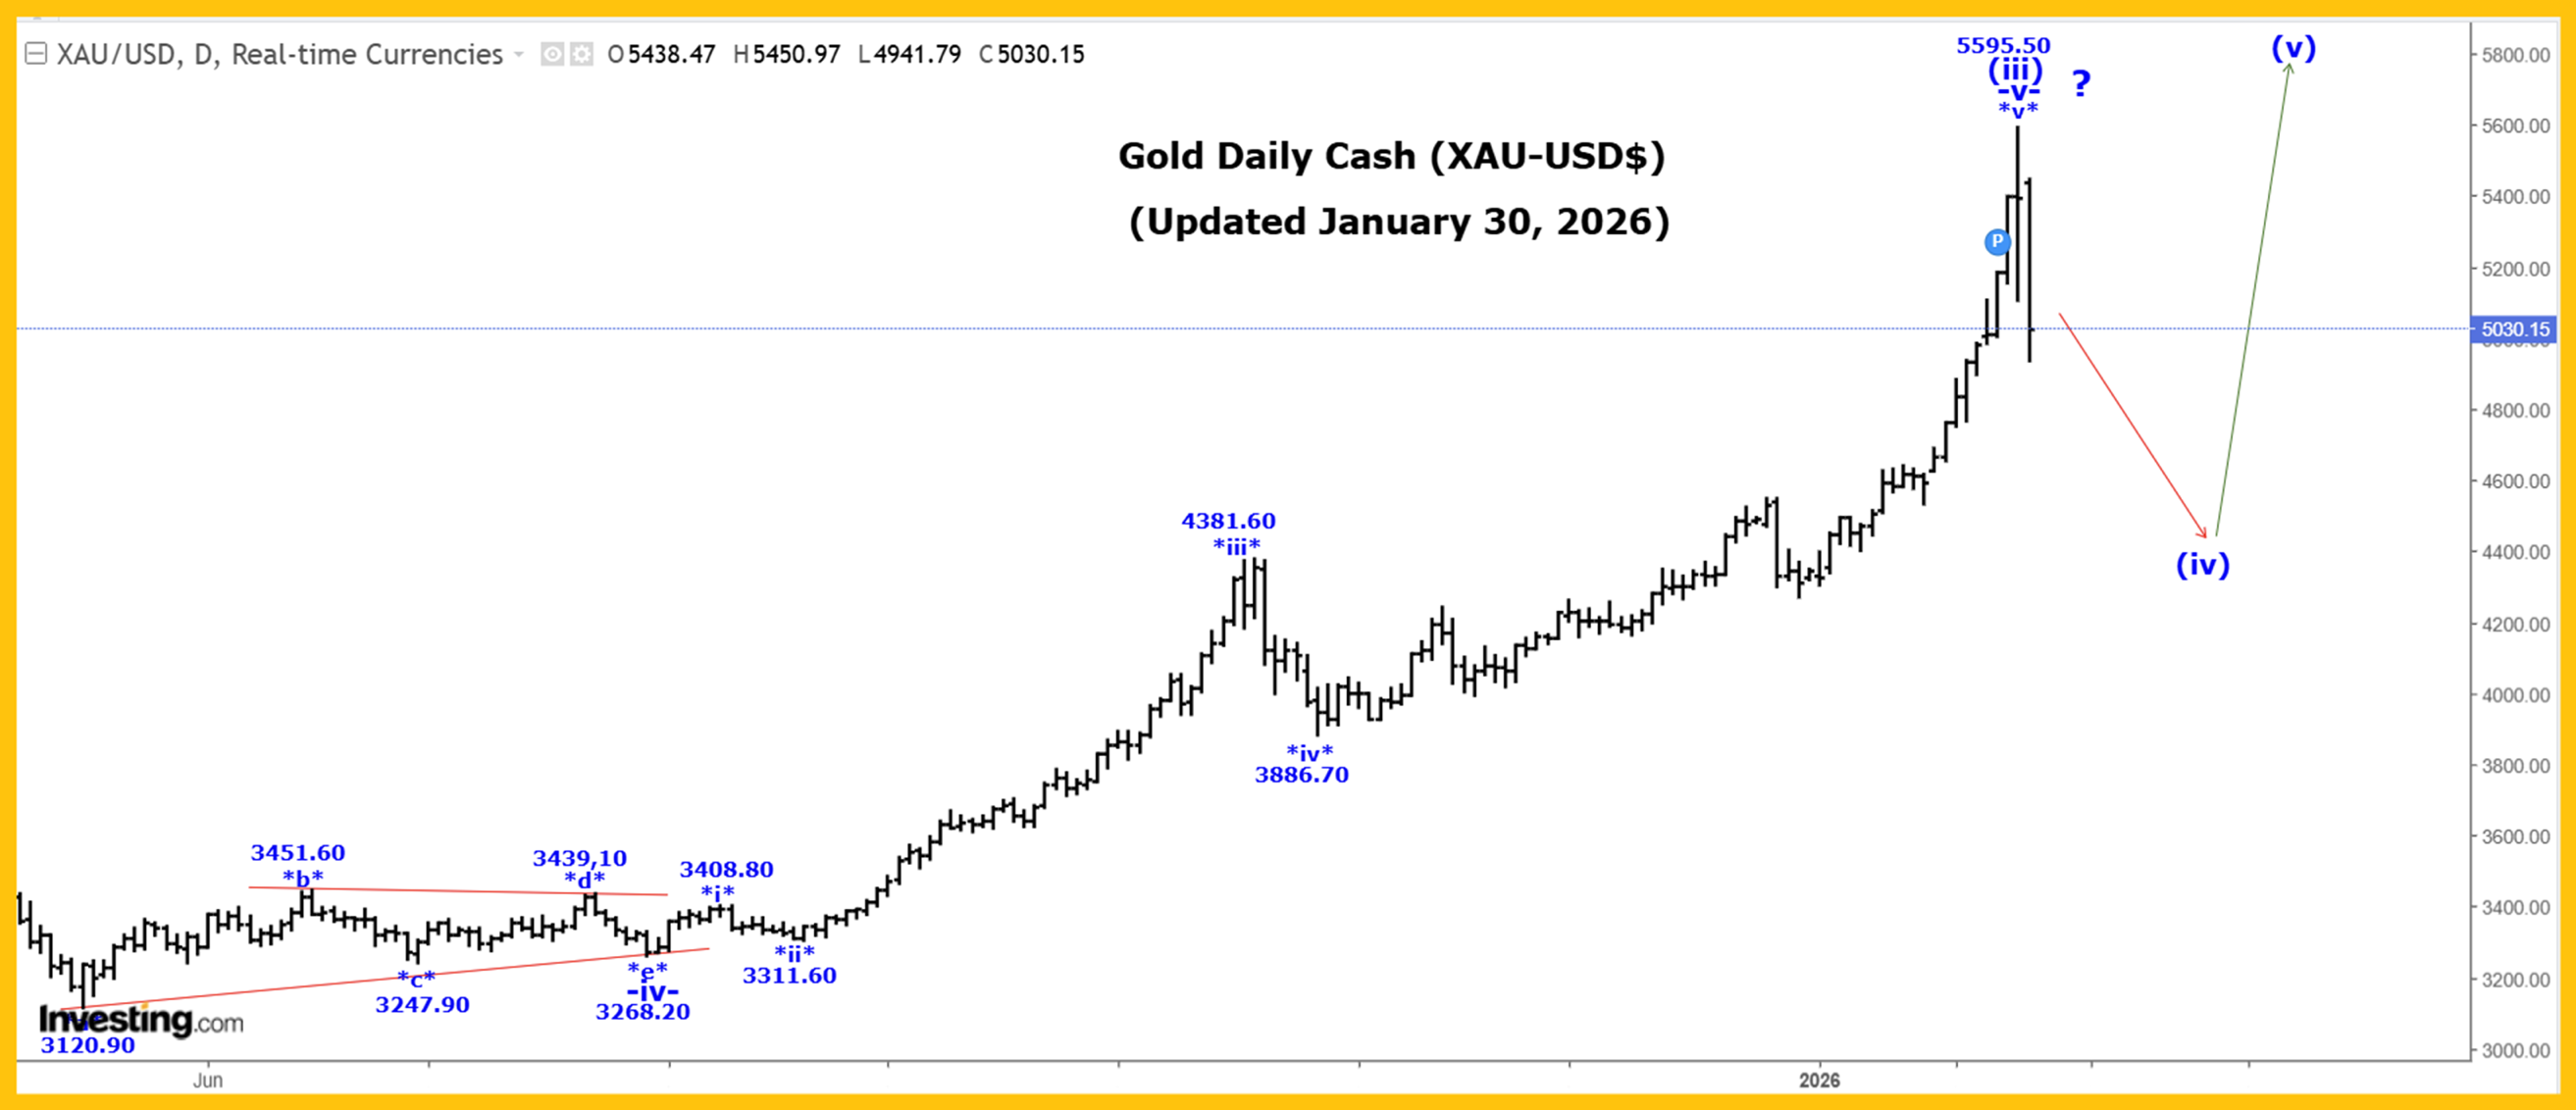
Gold was initially sharply higher again this past week, reaching another all-time high at 5595.40, although after the high was made, gold moved sharply lower, reaching a low of 4682.40!
Our current long-term gold count, starting from the 35.20 low made back in 1971:
1 = 1920.80.
2 = 1046.20.
3:
i = 2073.40.
ii = 1614.40.
iii:
(i) = 2073.30.
(ii) = 1810.10.
(iii):
-i- = 2790.40.
-ii- = 2539.90.
-iii- = 3500.30.
-iv- triangle = 3363.60.
-v- = 5595.40, to complete all of wave (iii).
(iv) drop is now underway.
A very powerful wave (iii) of iii is now complete at the 5595.40 high, and we are now falling in a multi-month wave (iv), a correction that has the following retracement levels:
23.6% = 4702.00
38.2% = 4149.40!
We have already reached our 23.6% retracement level, but we doubt that all of wave (iv) could already be complete.
While time isn’t part of Ewave analysis, we do expect very high volatility within wave (iv) as it develops over the next 3 to 6 months and perhaps for the rest of 2026!
Projections for the end of wave 3 are:
3 = 2.618(1) = 5936.00.
3 = 4.236(1) = 9033.60!
Active Positions: Flat!
SP500:
 The Captain’s 120-minute SP500 chart.
Analysis:
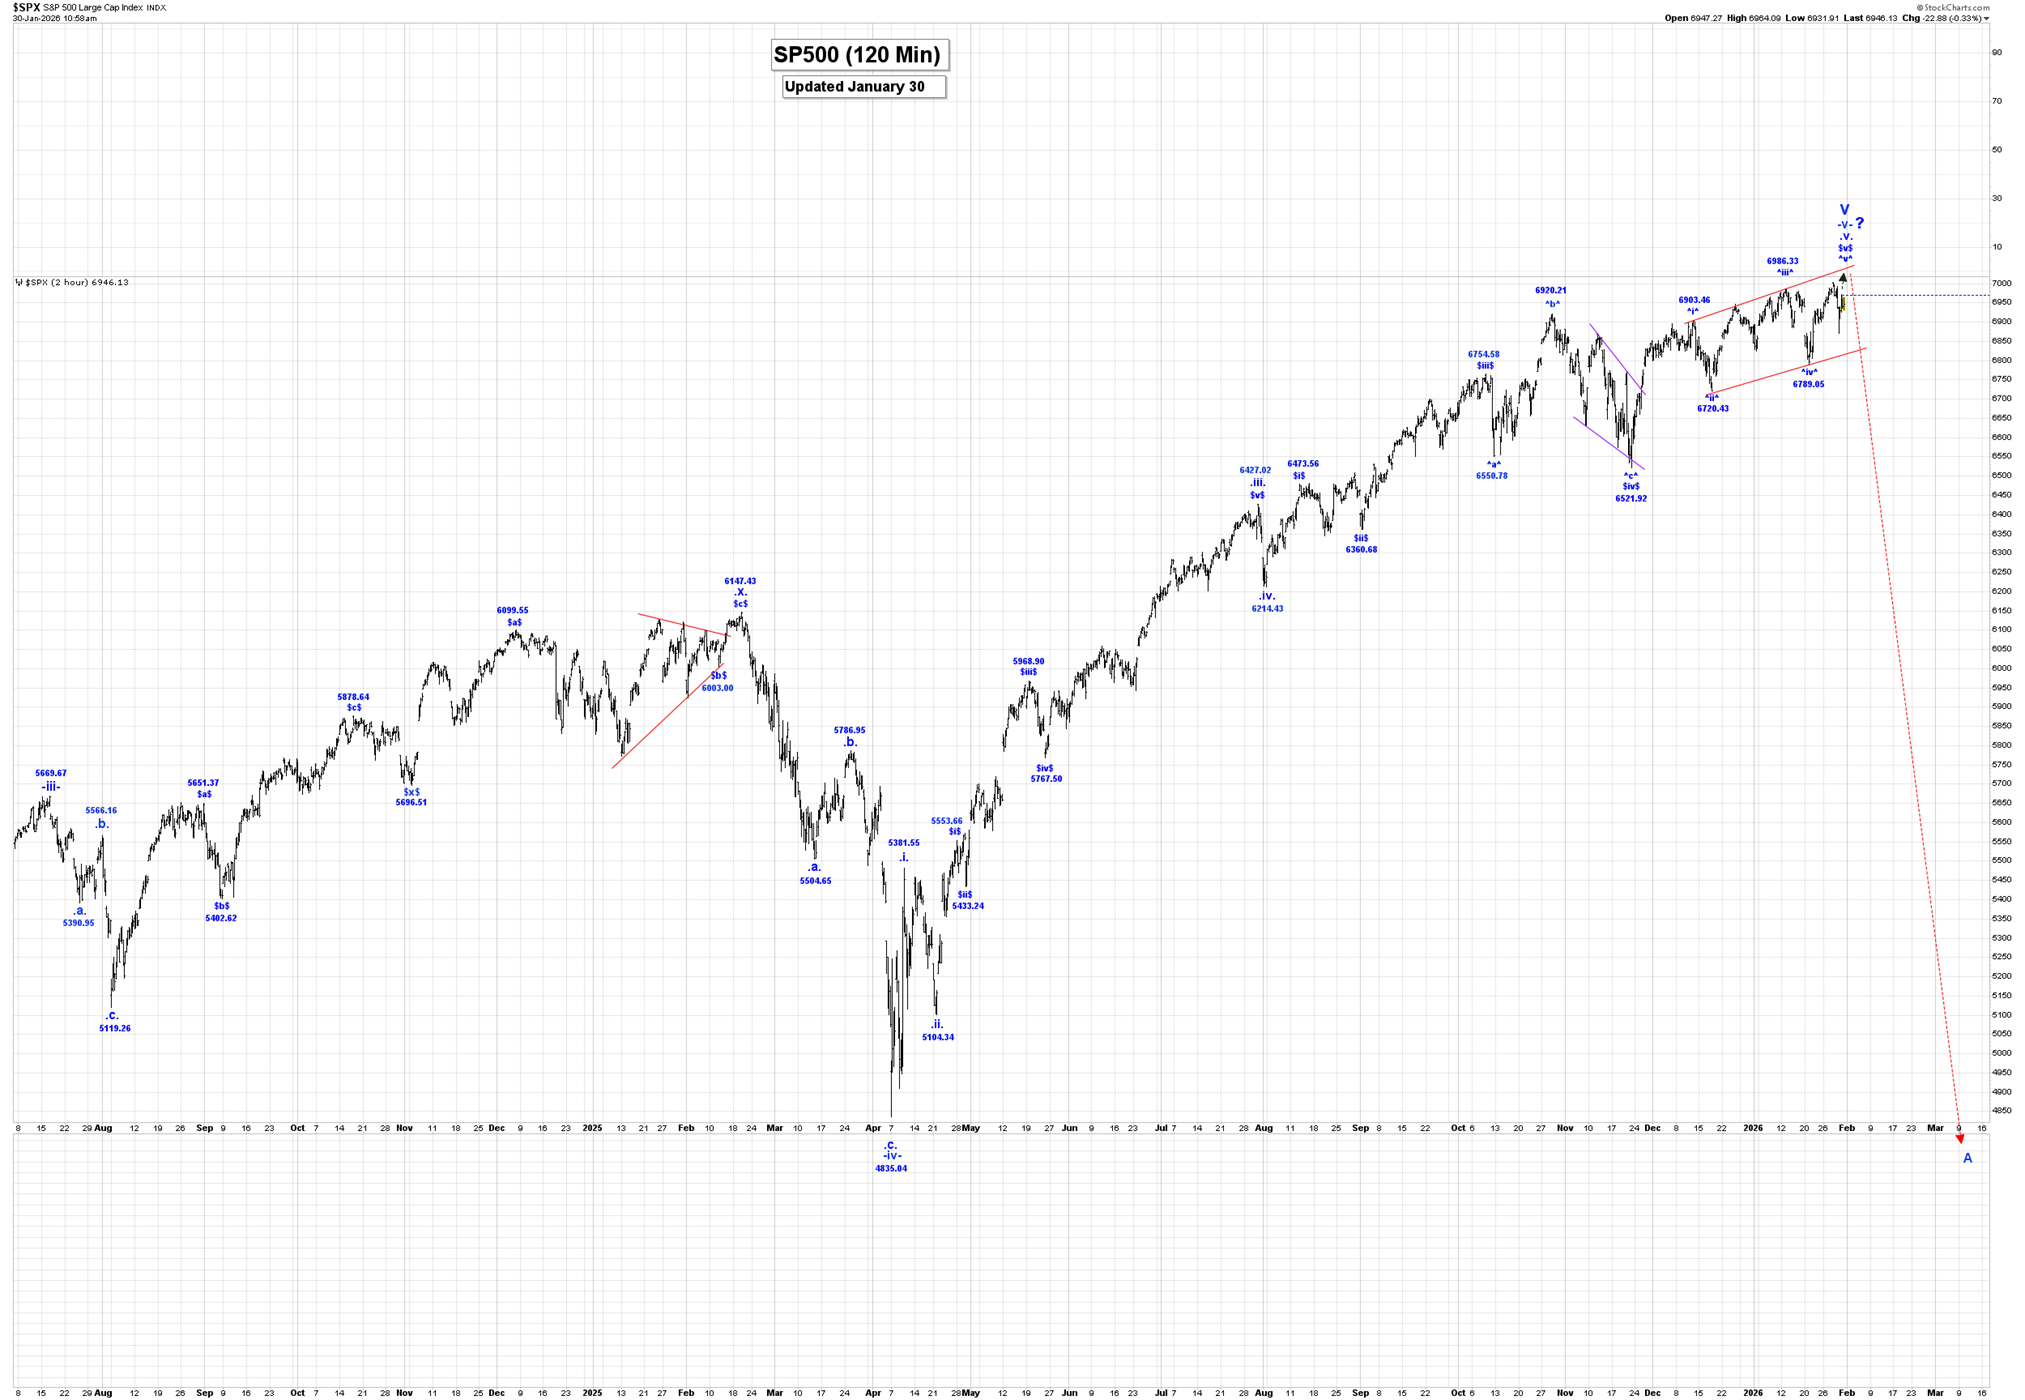
Our internal wave count for wave -v- has been updated as follows:
.i. = 5381.55.
.ii. = 5104.34.
.iii. = 6427.02.
.iv. = 6214.43
.v. with an internal wave count of:
$i$ = 6473.56.
$ii$ = 6360.68.
$iii$ = 6754.58.
$iv$ = 6521.92.
$v$: ending diagonal triangle, which is now expanding and extending, as follows:
^i^ = 6903.46.
^ii^ = 6720.43.
^iii^ = 6986.33.
^iv^ = 6789.05.
^v^ = 7002.00, if complete, to complete all of wave $v$.
Wave $v$ is expanding and extending, and only a break of the 6720.43 low would confirm that this formation has ended.
After wave V ends, we expect a very sharp sell-off in wave A, of a multi-year correction.
Active Positions: Flat!
GDX:
 The Captain’s weekly GDX chart.
 The daily chart.
Analysis:
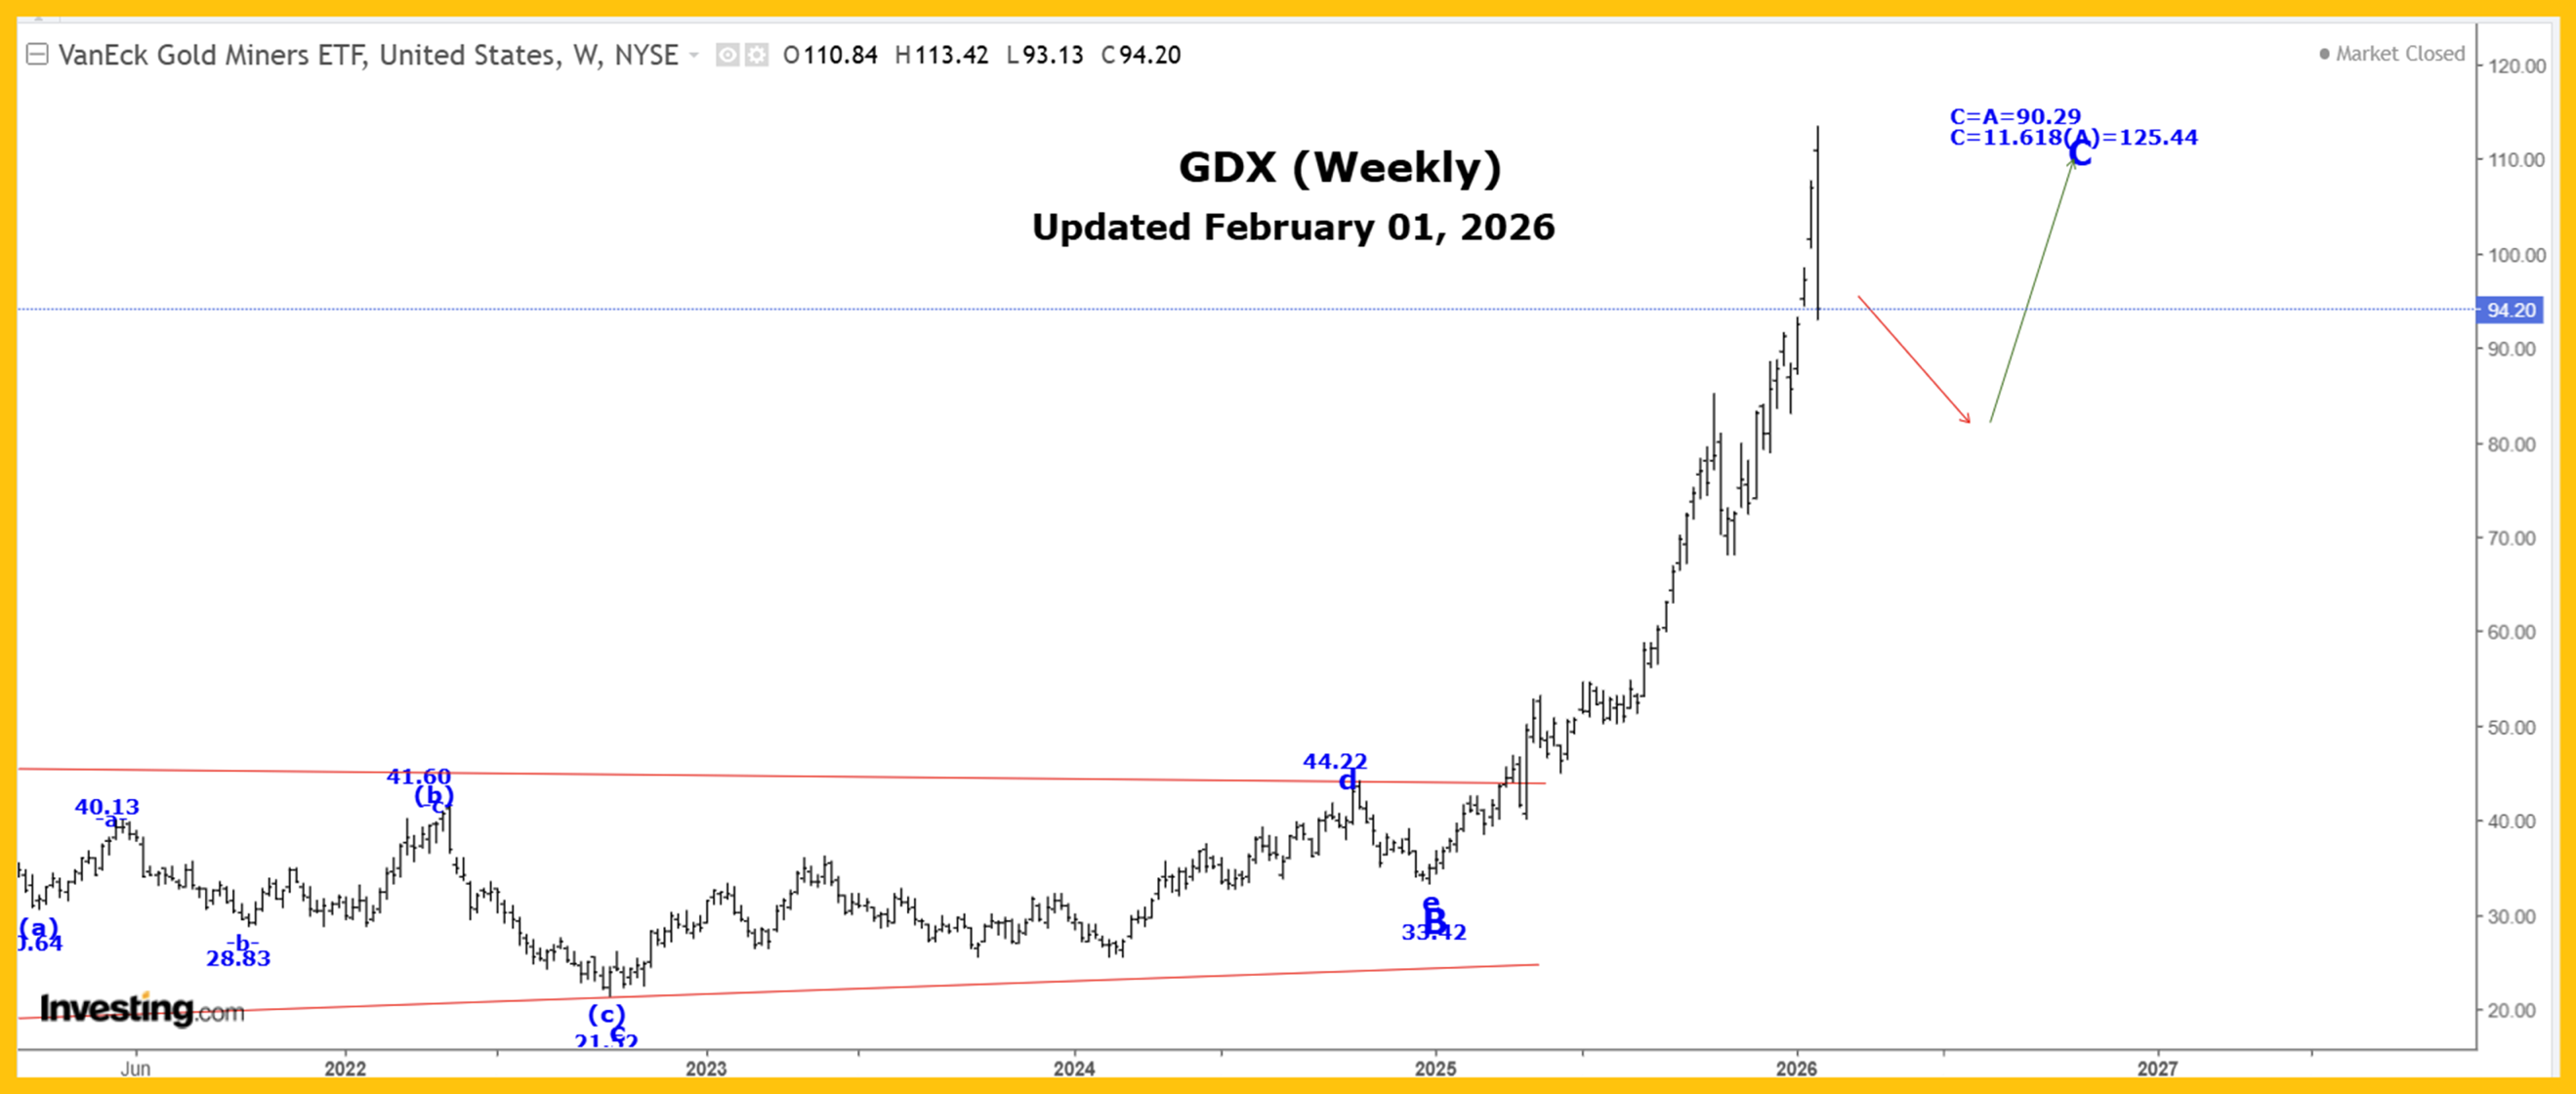
The GDX was initially higher again this past week, reaching another all-time high at 113.50, although after that high was made, we moved sharply lower, reaching a low of 93.12, closing at 94.20!
All of wave A ended at the 56.67 high in 2008, and all of our bullish wave triangle at 33.42, and we are continuing to move higher in wave C.
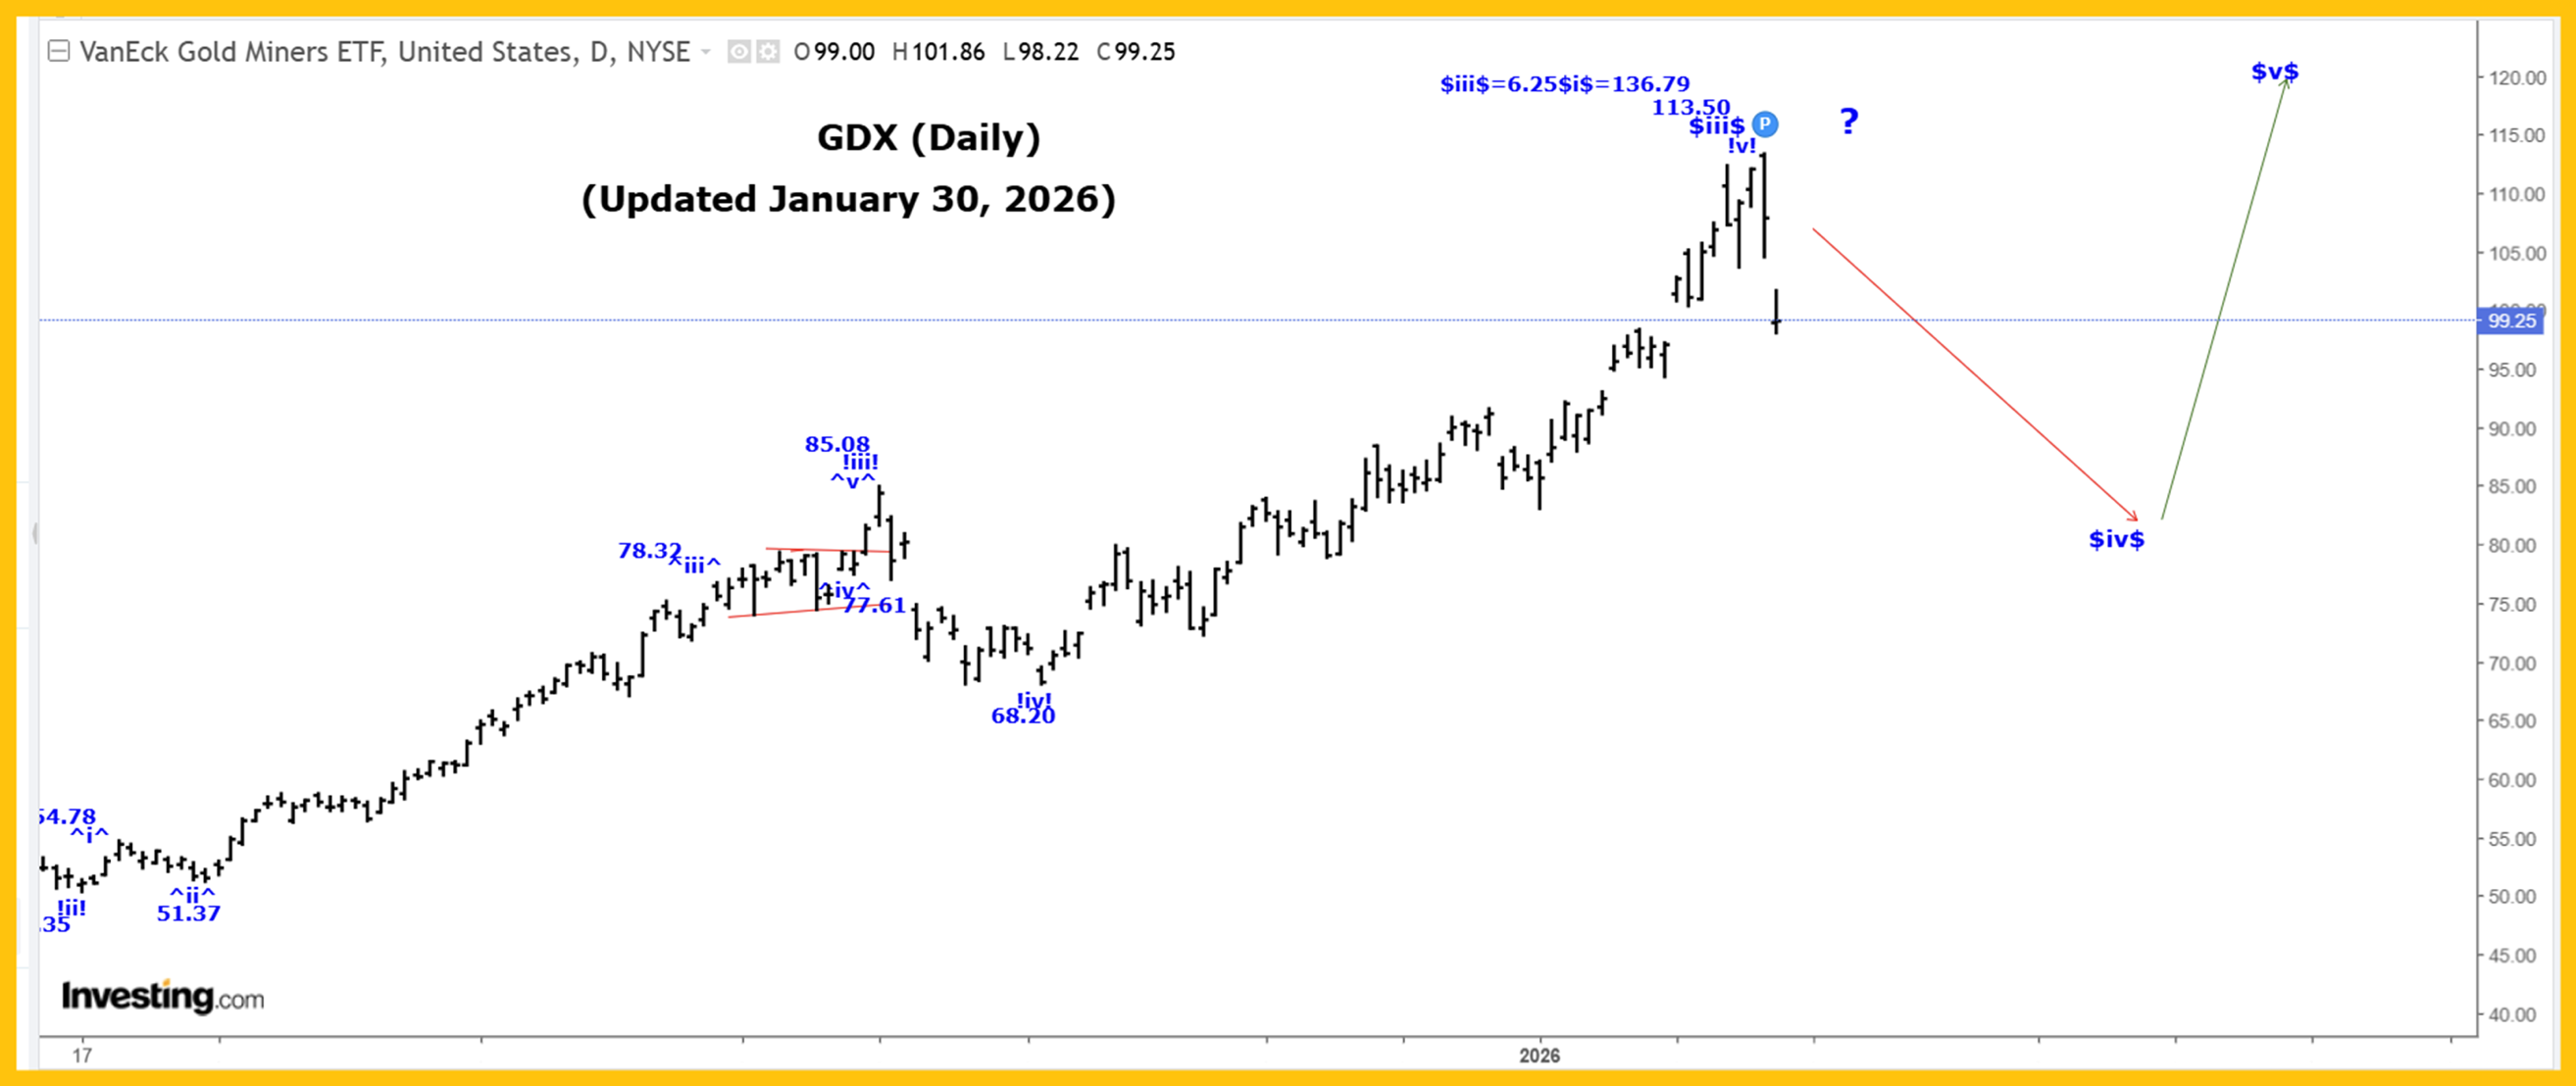
Within wave C, we completed weave (i) at 42.57 and wave (ii) at 38.58, and we are now moving higher in wave (iii) as follows:
$i$ = 53.25.
$i$ = 45.10.
$iii$ = 113.50.
$iv$ drop has started.
$v$ rally after wave $iv$ ends to complete all of wave (iii).
Our retracement levels for wave $iv$ are:
23.6% = 97.36.
38.2% =87.37.
We have already reached our 23.6% retracement level, but we doubt that all of wave $iv$ is already complete, and we expect it could take 3 to 6 months, and perhaps the rest of 2026 for it to develop.
Our current projection for the end of wave C is:
C = 1.618A = 125.44!
Within wave C: We completed wave (i) of i of C at 42.54, wave (ii) at 38.58, and we are still moving sharply higher in a subdividing wave (iii), as shown in our Daily and 60 Min GDX Charts.
Active Positions: Flat!
Thank-you!
Captain Ewave & Cre
Read the full article here