I’ve learned a few things while watching the COMEX precious metals every day for the past fifteen years. One lesson involves the timing and scale of new contract issuance during price rallies, and all of us just got reminder of this last week.
Let’s start with a matrix of sorts. What you see below isn’t universally true, but if you watch and record the daily price and open interest (OI) changes for COMEX gold and silver, you’ll soon see that it’s about 90% accurate.
- Price up, OI up: Speculators are adding longs, while Commercials are adding shorts.
- Price up, OI down: A short squeeze is likely underway.
- Price down, OI down: Speculators are being flushed out, and Commercials are covering shorts.
- Price down, OI up: Someone is aggressively shorting, driving prices lower.
COMEX Gold: What Happened Last Week
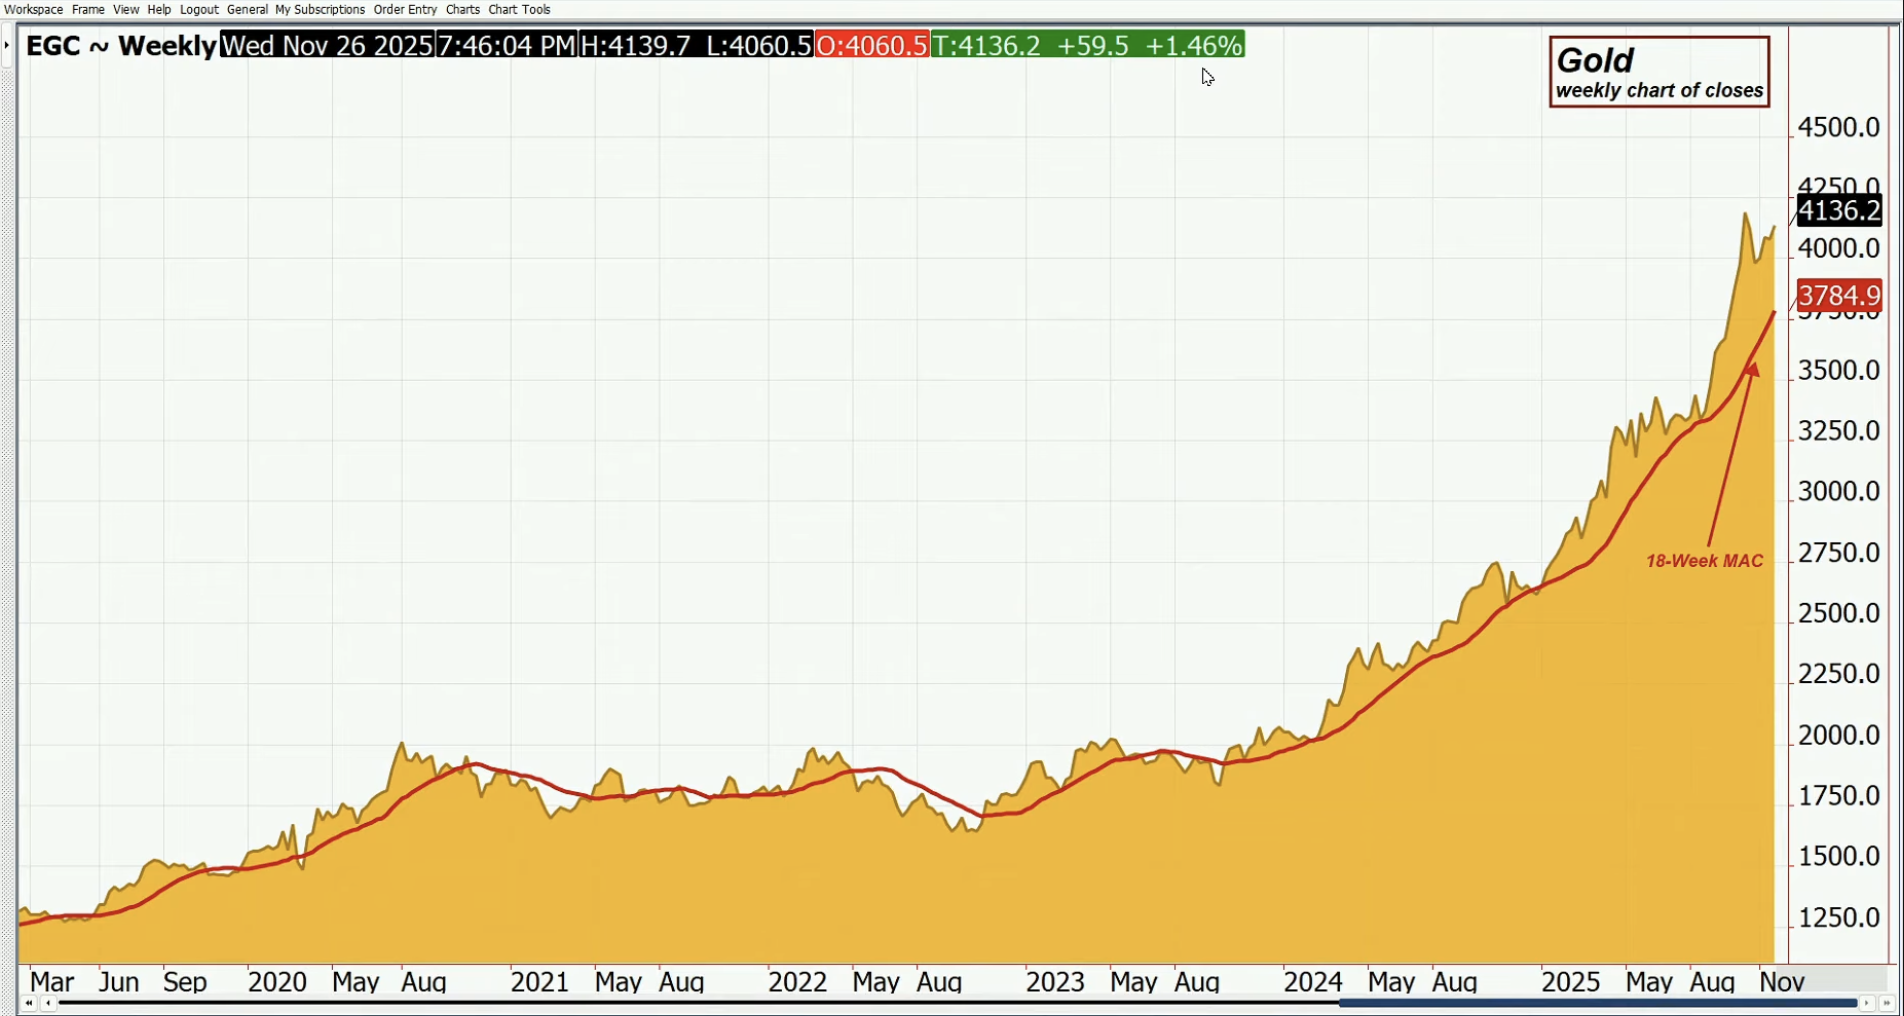
On Monday and Tuesday, July 21 and 22, COMEX gold surged by $85—or about 2.5%. At the same time, total open interest exploded by 42,670 contracts, a jump of roughly 9.5%. This price rally brought gold up to $3,441, marking its fourth attempt to break through the significant resistance level of $3,450—a ceiling that had already rejected advances three times over the past three months. See this chart from Tuesday, the 22nd:

Gold Price – Daily Chart
So, while price was moving up sharply and threatening to break out, the total float of COMEX gold contracts was suddenly increased by nearly 10%, and this new “liquidity” effectively absorbed some of the Speculator long demand. Yes, price rallied 2.5% in two days, but how much higher might it have gone if sellers of 42,670 existing contracts had to be found in order to meet the buying demand? Without the sudden 9.5% increase in the “float”, might price have broken out above $3450? We’ll never know.
About half of that new open interest came in the soon-to-be front month of Dec25, so you could argue that the sellers/shorters were simply providing the liquidity needed to build out contract
volume. But it sure came in handy that the Commercials were aggressively shorting on Monday and Tuesday of last week. Why? Because look at what happened next. Price fell over $100 the following three days and the $3450 level again held as critical resistance.

Gold Price – Daily Chart
And as you would expect, as price fell $108, total contract open interest fell backward, too, from that Tuesday high of 489,423 contracts to Friday’s 466,174. Why? Again, Specs bought longs as The Commercials added shorts Monday and Tuesday. However, many of those same Specs rushed right back out by dumping their longs Wednesday-Friday, which allowed The Commercials to cover their Monday-Tuesday shorts and retire the open interest.
Confirmed by the Commitment of Traders
You’ll see this verified in the weekly Commitment of Traders reports. These reports are surveyed each Tuesday and then posted three days later. Conveniently for us, this most recent report was surveyed at the COMEX close on…Tuesday, the 22nd. That’s handy! And what did it show? Please scroll up and refer to that bullet point matrix from earlier in this article. Price up with open interest up almost always means that the Large Speculators are adding longs while The Commercials are adding shorts. And what do we see below?

So your lesson this week is as follows…The next time you see the COMEX gold price rally up to a critical resistance point and do so while total contract open interest rises sharply, be prepared for the sharp reversal and pullback that is very likely to follow. What you just saw last week was not the first time this type of trading pattern has played out, and as long as the Bullion Banks are your primary market makers on COMEX, it won’t be the last time either.
Start investing in gold and silver today—capitalize on the next big move.
Don’t wait. Buy gold, buy silver while prices consolidate.
Read the full article here


Leave a Reply