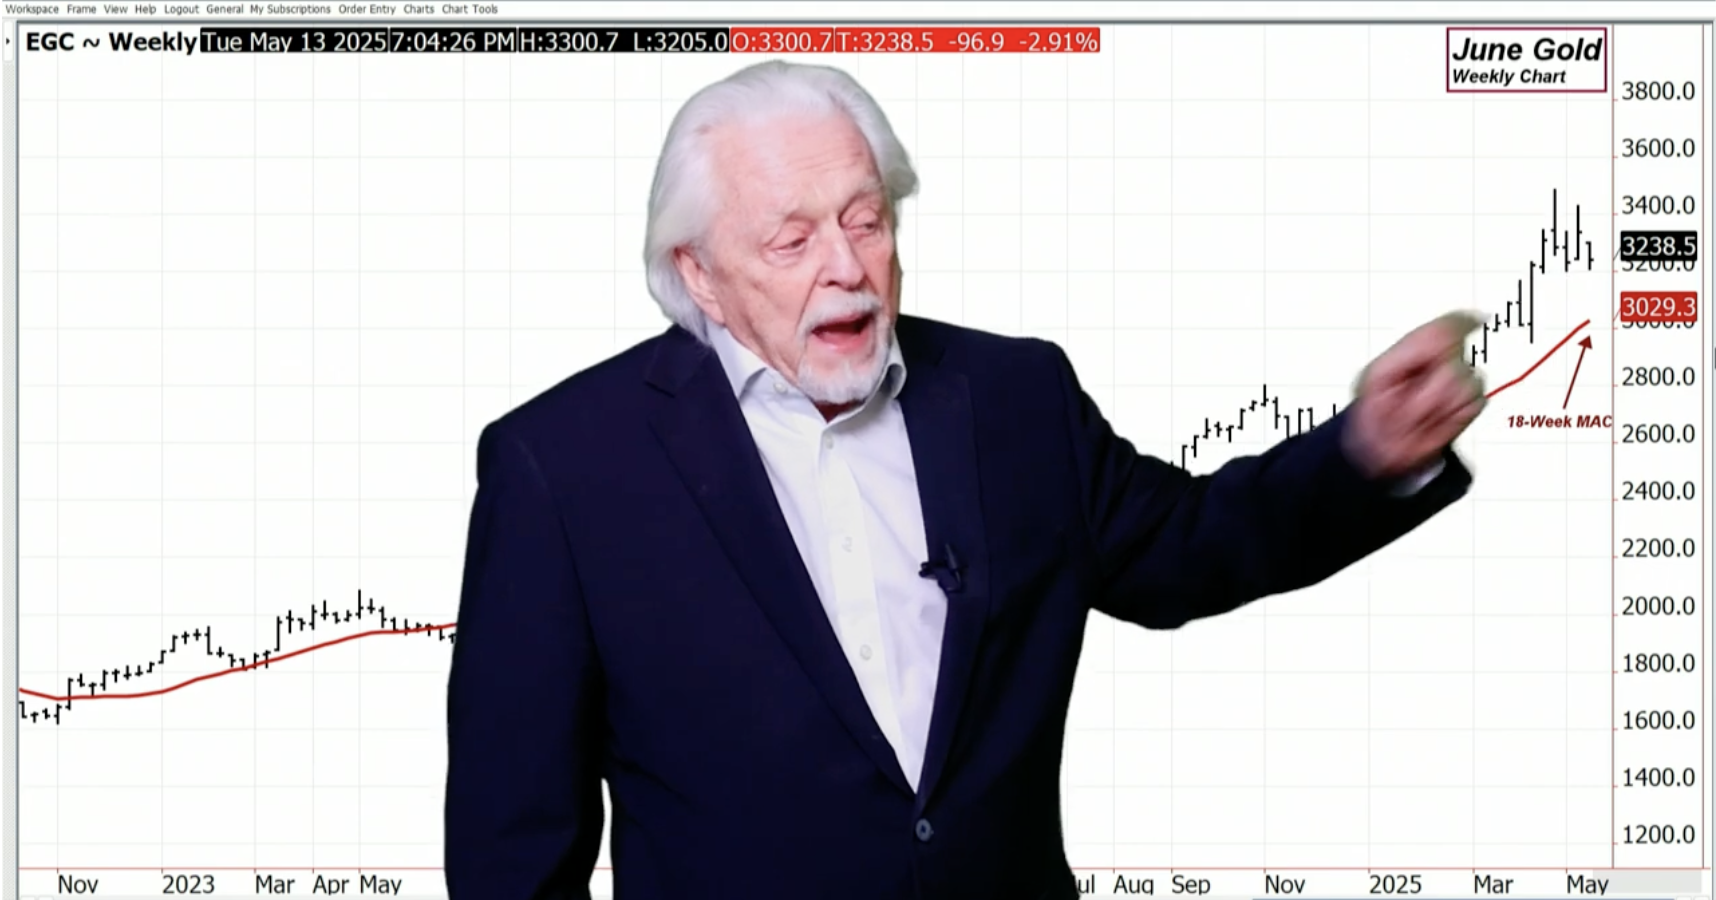
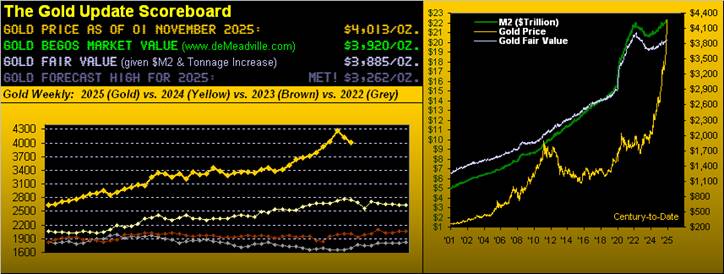
So, when we look at the gold chart, you can see how the market broke back down. When we come over to the daily chart, you can see that these lows have been coming in, and we have a pattern of a higher high and a lower low from back here. This low hasn’t taken out that one yet.
So you have downside bias, since you’re under the 18-day average of closes. You have no trend, and when you look at the next chart, the Bollinger Bands, you can see that you hit from top to bottom in one week, which is unusual to say the least. And you’ve quickly become oversold in the market.
Read the full article here


Leave a Reply