The US stock markets have been a wild ride, nearly plummeting into a new bear before screaming higher in a bear-market-rally-like surge! Such extreme volatility and a potential major trend change greatly ups the importance of big US stocks’ fundamentals. These behemoths dominating markets and investors’ portfolios just wrapped up another earnings season. Do their collective results bolster this bull or threaten a bear?
The flagship S&P 500 stock index recently enjoyed a massive bull run, powering 49.2% higher between late October 2023 to mid-February 2025! The SPX achieved a phenomenal 60 record closes during that 15.8-month span. It was remarkably-one-sided as well, suffering no 10%+ correction-grade selloffs. Smaller pullbacks climaxed at 5.5% in mid-April 2024, 8.5% in early August, and 4.2% into early September.
But after its latest peak, that powerful upleg started rolling over primarily on big-tariff fears. Just several weeks later in mid-March, the SPX had slumped 10.1% edging into correction territory. That technically slayed that upleg, putting traders on notice that a major trend change might be getting underway. That things-are-a-changin message was apparently confirmed in early April, when US stock markets plummeted.
Trump finally announced his reciprocal-tariffs plan on his so-called “Liberation Day”, after the close on April 2nd. Those tariffs were way steeper than feared, having dire implications for US corporate earnings. Around 4/10ths of the 500 SPX companies’ aggregate sales come from outside the US! So heavy selling slammed stock markets in the next couple days, with the benchmark SPX plummeting a brutal 4.8% and 6.0%!
Early the following week, the SPX’s closing loss since its mid-February peak extended to 18.9%. That was threatening 20%+ new-bear territory. With the critical-for-US-government Treasuries market suffering troubling dislocations, Trump capitulated delaying his reciprocal tariffs for 90 days. The SPX rocketed up 9.5% that day in a short-covering frenzy! That ignited a violent V-bounce growing to 14.1% gains last Friday.
Everything about this big-and-fast surge is bear-market-rally-like, though technically it isn’t a bear-market rally since the SPX narrowly avoided a new bear. The biggest-and-fastest surges in stock-market history are all bear-market rallies. They quickly rocket higher fueled by traders rushing to cover shorts, rapidly bleeding off excessive fear and rekindling greed. Had Trump not caved, the SPX likely would’ve fallen into a bear.
So US stock markets are at a critical juncture here, their massive upleg dead while a new bear was nearly awoken. That makes big US stocks’ fundamentals just illuminated by their Q1’25 results as important as ever. The probabilities for a new bear emerging from hibernation are proportional to how expensive big US stocks are relative to their underlying corporate profits. Ominously exiting Q1 they had bubble valuations!
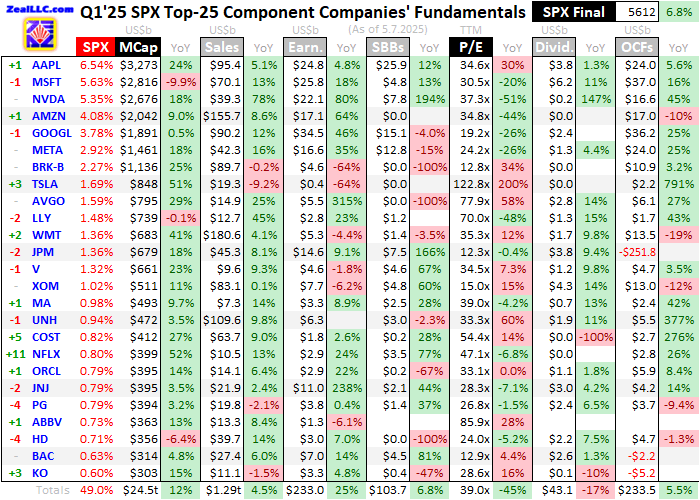
For 31 quarters in a row now, I’ve painstakingly analyzed the latest results just reported by the 25 biggest SPX components and US companies. Almost all American investors are heavily deployed in these behemoths due to fund managers crowding in! How big US stocks are collectively faring fundamentally offers clues on what markets are likely to do in coming months. This table includes key SPX-top-25-component results.
Each of these elite companies’ symbols are preceded by their SPX rankings changes over this past year, and followed by their index weightings exiting Q1’25. Next comes their quarter-end market capitalizations and year-over-year changes, revealing how these stocks performed. Looking at market caps instead of stock prices helps neutralize the distorting effects of massive stock buybacks artificially boosting prices.
Next comes a bunch of hard accounting data directly from 10-Q reports filed with the SEC. That includes each SPX-top-25 component’s quarterly sales, earnings, stock buybacks, dividends, and operating cash flows generated. Their quarter-end trailing-twelve-month price-to-earnings ratios are also shown. YoY percentage changes are included unless they’d be misleading, such as comparing positives with negatives.
Wall Street analysts like to frame quarterly results against their own expectations, which always paints a bullish picture for stocks. They need bullish psychology to maximize assets under management and their percentage-based fees. So they manipulate their expectations bars ensuring those can be beaten most of the time. A superior and more-honest way is evaluating results relative to the comparable prior-year quarter.
Even with that methodology, the big US stocks’ Q1’25 results generally proved spectacular! These elite companies are the best-of-the-best because of their amazing consistent size-defying growth. Despite operating at vast scales, they continue to see big revenues and earnings increases even from super-high bases. But those stellar performances are overshadowed by two huge risks, concentration and valuations.
Leaving Q1, these 25-largest S&P 500 stocks commanded 49.0% of that entire index’s collective market capitalization! While that improved a bit from Q4’24’s record of 51.7%, it is still troubling. The beloved Magnificent 7 mega-cap tech stocks alone weighed in at 30.0% of the entire SPX! While that improved from 33.7% at the end of Q4, such extreme concentration still flies in the face of prudent portfolio diversification.
That crucial wisdom for multiplying wealth extends back to ancient times. Israel’s king Solomon wrote in the Biblical book of Ecclesiastes at 11:2, “Invest in seven ventures, yes, in eight; you do not know what disaster may come upon the land.” Investors still crowding into mega-cap techs is the opposite, and led to outsized losses as stock markets plummeted a month ago. The S&P 500 collapsed 12.1% in four trading days.
Given their fantastic businesses and colossal scales, the Mag7 are often viewed as the strongest stocks to own during episodes of weakness. With far-better fundamentals than any other SPX sector, these market-darlings should weather selloffs well right? They actually underperformed during that four-trading-day plummeting, averaging 14.0% losses. But that must’ve been because that selloff was so violent right?
Extending that comparison across the SPX’s entire 18.9% correction from mid-February to early April looks even worse for the Mag7. In that exact span they averaged 26.8% losses, over 1.4x the S&P 500’s! And these colossal mega-cap techs accounting for nearly a third of the SPX’s weighting dragged down the entire index. So their losses were more outsized than that implies, which is nothing new for these stocks.
The SPX’s last bear was mild, a mere 25.4% loss from early January 2022 to mid-October that year. Yet the Mag7’s average losses surrounding that bear span were a brutal 54.6%! These market-darling stocks Wall Street endlessly hypes more than doubled the losses of the leading benchmark. Mega-cap techs’ astounding fundamentals have never protected them through major stock selloffs, where they fall much more.
So staying hyper-concentrated in them with the SPX flagging a potential major inflection certainly isn’t prudent. If the US stock markets are indeed rolling over into a new bear, it could be far more serious. From March 2000 to October 2002, the SPX plunged 49.1% over 30.5 months. Later between October 2007 to March 2009, the SPX collapsed 56.8% in 17.0 months! Major bears following bubbles can grow huge.
Still the 25-largest US companies’ fundamentals last quarter were super-impressive. Despite their vast operating scales, their total revenues grew 4.5% YoY to $1,287b. That was still the slowest sales growth in seven quarters, and it all came in the Mag7. Their revenues soared 12.3% YoY to $512b, while the next-18-largest SPX companies’ sales shrank a slight 0.0% to $774b. And that was before Trump’s big tariffs.
Bottom-line GAAP earnings reported to the SEC were similarly bifurcated between mega-cap techs and everything else. Overall SPX-top-25 corporate profits soared 24.7% YoY to $233b, their strongest growth in three quarters. The Mag7 clocking in at phenomenal 34.1% earnings growth to $141b dominated that, while the next-18-largest’s merely grew 12.5% YoY to $92b. And that is skewed high by a big unusual item.
The second-largest profits growth among the SPX top 25 last quarter was medical giant Johnson & Johnson’s 237.9% skyrocketing to $11.0b! When I wade through all these 10-Q reports, I always look for unusual items in income statements. JNJ reported a colossal $7.3b of other income last quarter, which it didn’t even bother detailing with a financial-statement note. That lack of clarification on such a big item is shocking.
While SEC filings offer way more detail on quarterly results, JNJ’s press release included a line about Q1 earnings per share stating it “includes the reversal of special charges”. Nothing else was mentioned, and searching for those terms in its 51-page 10-Q yielded nothing. But I dug deeper to find out that was a reversal of a previously-accrued reserve for settling lawsuits on talcum powder with asbestos causing cancer.
If that is excluded from next-18-biggest profits, their growth falls from 12.5% YoY to just 3.6%! Offsetting that though is Warren Buffett’s giant investment conglomerate Berkshire Hathaway. It was sad to see this living legend just announce he will soon step down, but at 94 years old and the world’s sixth-richest man no one deserves retirement more! Accounting rules make Berkshire’s quarterly earnings crazy-volatile.
Unrealized gains and losses on stocks have to be flushed through income statements each quarter, which has long irritated Buffett. Those included $6.4b in investment losses in Q1’25, which makes sense as the SPX fell 4.6% in it. Add those back in, and BRK’s net earnings were closer to $11.0b which climbed a slight 2.0% YoY from similarly-adjusted Q1’24’s. Given Berkshire’s reach, that likely reflects the US economy.
Interestingly and unusually, Alphabet also had a Berkshire-like adjustment last quarter. It reported utterly-staggering net earnings of $34.5b, the highest in the US stock markets by far! That included $9.8b in net gains on equity securities, in a down quarter for the SPX. Such unusual items may become a bigger deal for GOOGL going forward, as it had a whopping $72b of marketable securities on its books exiting March.
These big US companies dominating US stock markets and investors’ portfolios earned huge profits last quarter. That $233b total was the second-largest ever, only behind Q4’24’s staggering $248b! But that’s not necessarily bullish for stock markets, as earnings are only half the equation. Equally as important is how much traders have to pay for those profits. Price-to-earnings ratios are the stock-valuation gold standard.
Over the last century-and-a-half or so, US stock markets have averaged trading at about 14x earnings. In other words, it takes companies about 14 years to earn back the prices investors are paying for them. This long-term average is effectively fair-value, and it is reasonable. The reciprocal of that implies annual returns of 7.1%, a fair cost for companies to pay for scarce capital and a fair yield for investors to provide it.
Double fair-value at 28x earnings is where bubble territory has started historically. When stock markets experience such strong secular bulls that average stock prices more than double long-term averages, the odds soar for subsequent major bear markets. The purpose of those bears is to maul stock prices lower and sideways long enough for underlying corporate profits to catch up with stock prices, normalizing valuations.
At the end of Q1’25, these elite SPX-top-25 big US stocks averaged trailing-twelve-month P/E ratios way up at 39.0x! There wasn’t much of a difference between the Magnificent 7 at 43.3x and the next-18-largest SPX stocks at 37.3x. But the former two averages were skewed higher by Tesla’s crazy 122.8x. Without that the SPX top 25 and Mag7 still averaged 35.5x and 30.1x, both still well into 28x bubble territory.
P/E ratios divide stock prices by earnings per share to yield valuations. Another way to calculate them is taking the SPX top 25’s total market capitalization of $24,506b exiting Q1’25 and dividing that by their last four quarters’ total bottom-line profits of $915b. With no averages included, that minimizes any skewing. Yet that still shows big US companies’ prices running at 26.8x their earnings, still nearly at bubble levels!
And ominously absent a major stock-market selloff, these lofty valuations could easily head even higher. American consumer spending drives about 7/10ths of the entire US economy, and thus a similar proportion of corporate profits. Yet the great majority of Americans are struggling, with budgets pinched between stagnant incomes and festering way-higher prices for life’s necessities than before recent years’ dreadful inflation.
We are all forced to pay much more for housing, food, insurance, and medical expenses than before the pandemic lockdowns and colossal Fed money printing since. Those crushing non-optional expenses leave much less left over for discretionary purchases. With needs dominating budgets, wants have to take a back seat. And most of the goods and services sold by these biggest US companies are merely wants.
This is most apparent in the beloved Mag7, which is a serious stock-market risk since their Q1’25 profits accounted for 61% of the entire SPX top 25’s! If cash-strapped Americans are forced to pull back on both direct and indirect buying of Mag7 products, their profits will fall sharply catapulting SPX valuations much higher. And Americans are also now drowning in record debt according to Federal Reserve data tracking it.
Leaving Q1, mighty Apple was the largest US stock by far with a $3,273b market cap. Fully half of its Q1 sales came from iPhones. While they are sure handy devices, do Americans really need to buy new ones every couple years? A three-or-four-year-old iPhone is still very fast, functioning and looking essentially the same as the latest models. If pinched Americans slow their iPhone upgrades, Apple’s profits are in trouble.
Still on the consumer side, what percent of Amazon’s sales are for wants instead of needs? That has to be really high. With incomes failing to keep up with soaring expenses, Americans will have to cut back on discretionary purchases. Amazon’s goods are also dominantly-sourced from China, which now faces crazy 145% tariffs from Trump! Those will have to force Amazon selling prices higher, which will retard demand.
Most Americans are worried about Trump’s big-tariffs regime also driving up prices, so they have pulled forward potentially-affected purchases where they can. That likely contributed to bigger-than-normal Q1 consumer demand and earnings, but cannibalized future quarters’. Anecdotal media reports indicate that included lots of big-ticket purchases like cars, appliances, computers, and inventory businesses hope to sell.
Even before Elon Musk threw in with Trump infuriating Tesla’s mostly-liberal customer base, its cars have primarily been luxury items. While nice to drive, they are expensive and can easily be substituted with cheaper cars. Tesla’s Q1’25 car sales plunged 21.8% YoY! Wall Street assumes that was due to Musk’s politics and will reverse. But with Americans increasingly struggling, this economy was likely a big factor too.
Alphabet and Meta are pretty much fully dependent on business advertising. When companies large and small see flagging sales as struggling Americans pull back discretionary spending, ad buys are the easiest thing to cut. If online advertising isn’t driving sufficient demand for corporate products, the ad platforms’ sales and profits could plunge fast. Weakening consumer spending will also weigh heavily on the AI buildout.
NVIDIA’s GPUs are the backbone of that, which the other mega-cap techs are spending hundreds of billions of dollars on. But Microsoft and Alphabet have yet to see any material returns on their massive AI spending. Meta claims AI is boosting ad buying, but that could roll over too with consumer spending increasingly deteriorating. The rest of the Mag7 buying less from NVIDIA would tank its revenues and earnings.
The risks to colossal Mag7 profits go on and on. Just this week, a top Apple executive testifying in court said web search volumes on iPhones fell for the first time ever in April. Apple and Alphabet stocks dropped on that since the latter pays the former an estimated $20b per year to make Google the default search option on iPhones! That could be in jeopardy if Apple decides to switch searches to AI-driven services.
On AI and search, that also has big potential to hurt Alphabet. Google searches now include an AI-driven summary on top of all the usual links. Despite horrendous AI hallucination rates of being wrong, people assume summaries are correct and don’t dig deeper. That is strangling small businesses advertising on Google that rely on it for traffic and sales. The less clickthroughs they get, the less they will spend on ads.
So Wall Street’s assumption that big US stocks’ huge earnings will consistently grow indefinitely seems really misplaced with all this upheaval. Slowing sales are multiplied by profits’ inherent leverage to them, and they could start falling for plenty SPX-top-25 stocks. That would force already-bubble valuations deeper into that dangerous bear-birthing realm. This is certainly not the stock-market environment for sanguinity.
Earnings ultimately feed corporate stock buybacks, which grew 6.8% YoY to $104b across the SPX-top-25 companies in Q1’25. That was the second-highest on record, which could indicate either strength or desperation. Over the past four quarters, growth in buybacks has slowed dramatically up 29.0%, 23.8%, 15.2%, and that 6.8% YoY. If earnings come under pressure, so will massive buybacks boosting stock prices.
Shockingly once-sacrosanct dividends plunged 17.4% YoY to $43b across these elite US companies in Q1! But that is heavily distorted by two developments. First in Q1’24 Costco declared a one-time special cash dividend of $6.7b, second Coca-Cola edged into the SPX-top-25 ranks displacing oil supermajor Chevron which pays far-larger dividends. Adjust for these, and big US stocks’ dividends grew a normal 1.1% YoY.
The SPX top 25’s collective cash flows generated from operations excluding the hyper-volatile money-center megabanks’ climbed 5.5% YoY to $233b. These big US stocks’ total cash treasuries soared 20.4% YoY to $1,065b. But that’s mostly because Berkshire Hathaway upped its epic cash hoard by 84.0% YoY to an eye-popping $348b! With Buffett and crew paid to invest money, that’s a really-bearish omen.
They are not holding record cash because they want to, but because they can’t find good deals to buy stocks or private businesses. The Oracle of Omaha knows these stock markets are wildly-overvalued, and is accordingly holding fire on deploying capital. Berkshire has been a net seller of stocks for fully ten quarters in a row now! Buffett doesn’t want to say a bear market is coming, but his actions show he fears it.
So investors need to gird themselves psychologically for a much-bigger selloff and prepare their portfolios accordingly. That can include reducing massive overallocations in mega-cap tech, tightening stop losses, and diversifying with counter-moving gold. Despite its powerful bull market, American stock investors still have virtually no gold allocations. While crazy-overbought and needing to correct, gold’s secular bull is far from over.
Successful trading demands always staying informed on markets, to understand opportunities as they arise. We can help! For decades we’ve published popular weekly and monthly newsletters focused on contrarian speculation and investment. They draw on my vast experience, knowledge, wisdom, and ongoing research to explain what’s going on in the markets, why, and how to trade them with specific stocks.
Our holistic integrated contrarian approach has proven very successful, and you can reap the benefits for only $10 an issue. We extensively research gold and silver miners to find cheap fundamentally-superior mid-tiers and juniors with outsized upside potential. Sign up for free e-mail notifications when we publish new content. Even better, subscribe today to our acclaimed newsletters and start growing smarter and richer!
The bottom line is big US stocks just reported fantastic Q1 results, including near-record sales and profits. But those outstanding fundamentals are misleading if these lofty stock prices are ignored. Even massive earnings are still way too low relative to prevailing stock levels, leaving valuations in dangerous bubble territory exiting Q1. The subsequent sharp selloff threatening a new bear really underscored that serious risk.
And big US stocks’ profits face lots of downside pressure in coming quarters. Tariffs forcing costs higher can’t all be passed on to increasingly-cash-strapped American consumers. Drowning in debt, they have to pull in their horns buying less of the products companies sell. That portends eroding revenues which earnings will leverage, forcing bubble valuations even higher really increasing the likelihood of a serious bear.
Adam Hamilton, CPA
May 9, 2025
Copyright 2000 – 2025 Zeal LLC (www.ZealLLC.com)
Read the full article here



Leave a Reply