
?")
Apropos of this missive’s title — and with the year’s first quadrimester (plus two May trading days) already in the books — let’s start with another of our infamous Gold Quizzes. Ready?
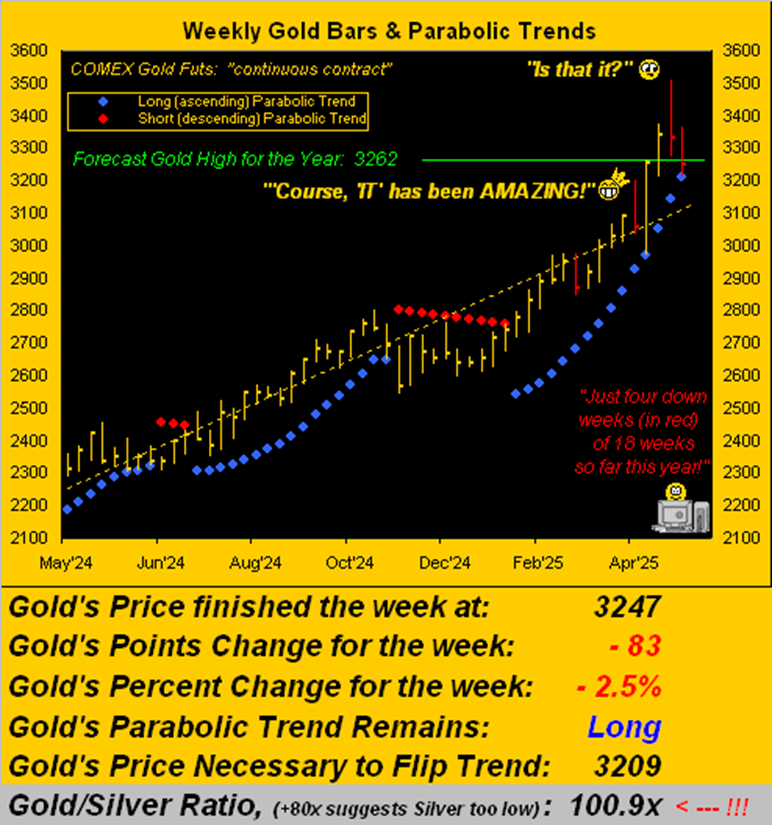
In settling yesterday, (Friday) at 3247, Gold completed its 18th trading week of the year with a net weekly loss — as just was the case in the 17th week! Thus, prior to this:
- When was the last time Gold recorded two consecutive down weeks?
“Oh that one’s easy, mmb! Not since last year!”
My dear Squire, such quiz is directed toward our highly-valued audience, rather than be front-run in-house. Still, in this instance, “A Man for All Seasons” –[Columbia, ’66], is not Sir Thomas More, but indeed Sir Squire. Let’s simply add some specificity to his statement:
Through these 18 weeks of 2025, Gold has recorded but four that were net down. However, three of those down weeks are amongst the past five, even within which price has made a weekly “higher-high” four times. And to answer the quiz: Gold’s last two consecutive down weeks were the last two weeks of 2024.
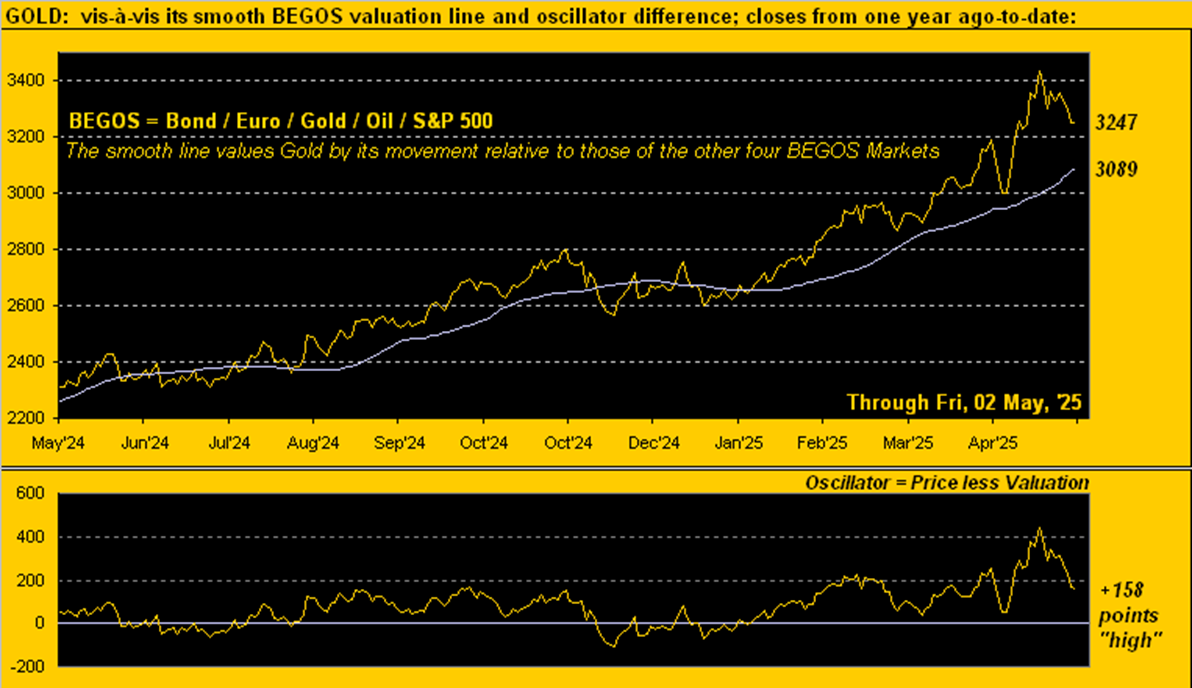
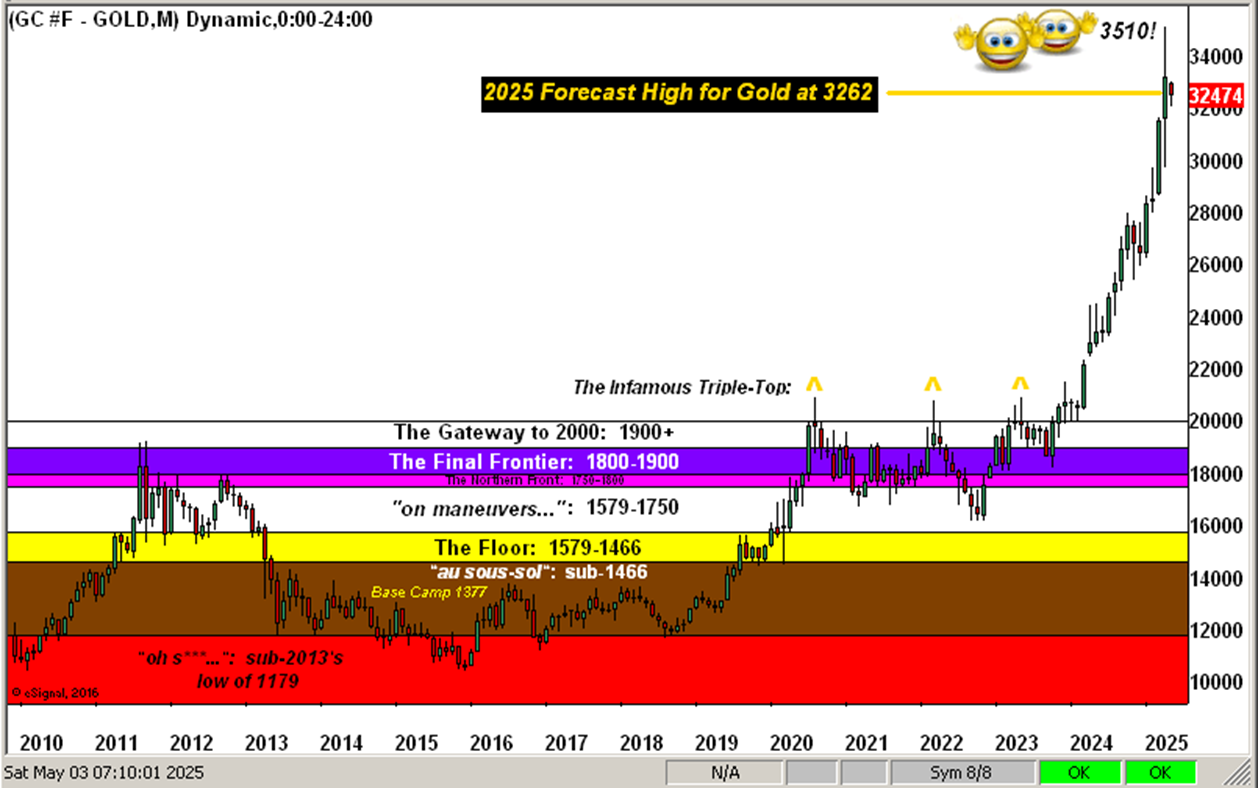
To be sure, in 2025, Gold has had a great run … but is it finally done? By our opening Gold Scoreboard, Gold today at 3247 is -16% below its Dollar debasement value of 3879. Still, price — with only a third of this year having passed — has already traced 117% of its expected yearly trading range. Yet hardly ought that be surprising given Gold’s great breakout. But as you regular readers well know, the year’s high (thus far?) at 3510 elicited an ever-so extensive stretch above our BEGOS Markets’ valuation for Gold. And it remains the case — even as price is reverting to said valuation — that Gold remains relatively +158 points “high” (at 3247) to such reversion destination (at 3029). Yet clearly that valuation itself is rightly rising each day:
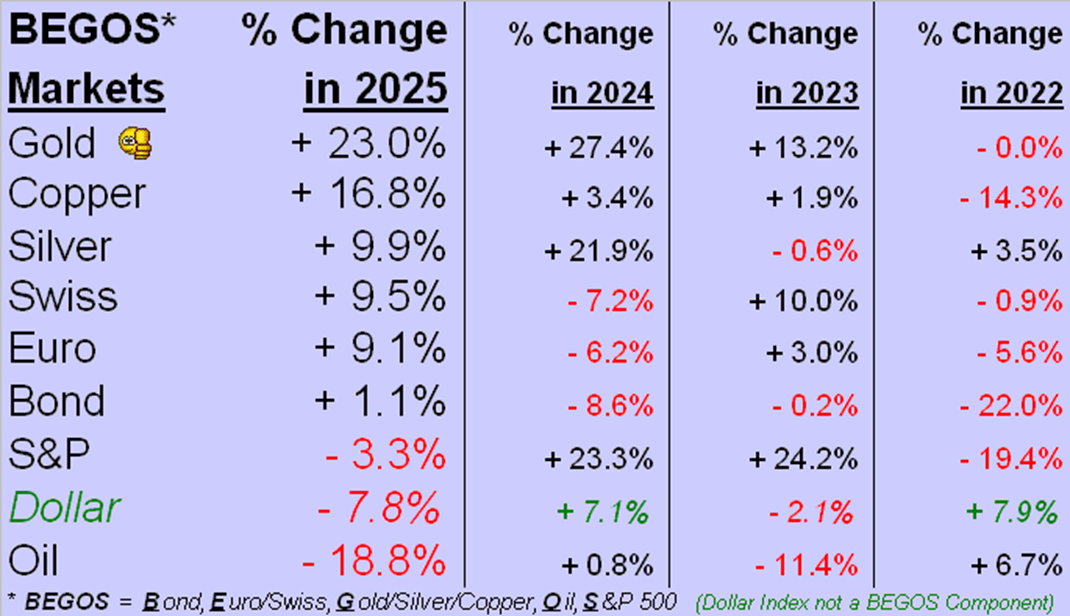
Bespoke of the BEGOS Markets, Gold firmly finds itself at the top of the table as we turn to the Standings year-to-date. And has been the case throughout, all three podium positions comprise our Metals Triumvirate. But therein note Silver remaining woefully undervalued relative to Gold. In 2025, Gold so far is +23.0% and Copper +16.8%: so ought Silver at least be between those two (given the tug of war over her being both a precious metal as well as one that is industrial) rather than “only” +9.9%? Too, the Gold/Silver ratio is again 100.9x relative to its century-to-date evolving average of now 69.0x. By our expertise to reprise, priced to said ratio today places Silver (instead of at her current 32.18 level) +46% higher at 47.09. Might Silver thus be “the easiest Long trade” for the foreseeable future? We eloquently answer: “Well DUH!”
Specific to Gold and its three down weeks in the last five, let’s go to the weekly bars from one year ago-to-date. We’ve highlighted in red all four down weeks recorded so far in 2025. Moreover, note the rightmost parabolic Long trend blue dot: should Gold break below 3209 in the ensuing week, such trend shall flip to Short. Obviously such flip price is well within range (just -38 points below here) given Gold’s “expected daily trading range” is presently 83 points, let alone the “expected weekly trading range” now a whopping 140 points(!) The Golden wave of euphoria has Long been waving; but from here it may be Short-lived, barring a basically “straight-up” week in the offing; else Gold’s great run — at least for the present — may well be done:
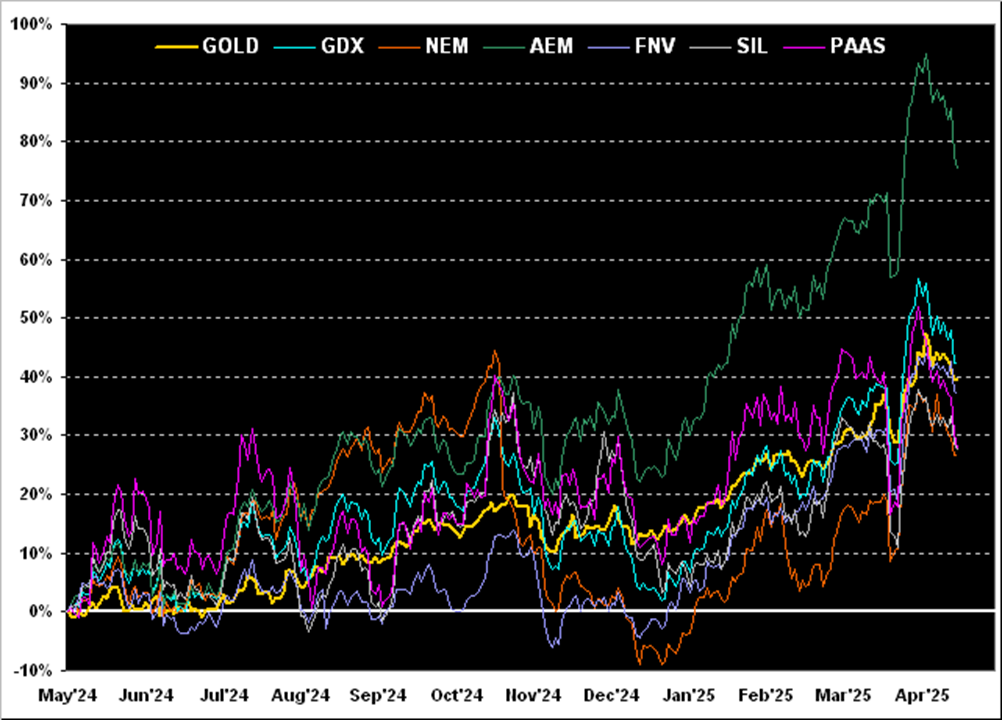
Naturally it being month-end and two trading days into May, ’tis time to bring up the year-over-year percentage tracks of Gold along with several tip-tier precious metal equities. From least-to-most we below see Newmont (NEM) +27%, both the Global X Silver Miners exchange-traded fund (SIL) and Pan American Silver (PAAS) +28%, Franco-Nevada (FNV) +37%, Gold itself +39%, the VanEck Vectors Gold Miners exchange-traded fund (GDX) +42%, and Agnico Eagle Mines (AEM) +75%. (Were you in the S&P 500 from a year ago, your dividend-inclusive gain is +15% … even as you’re behind this year … oh dear):
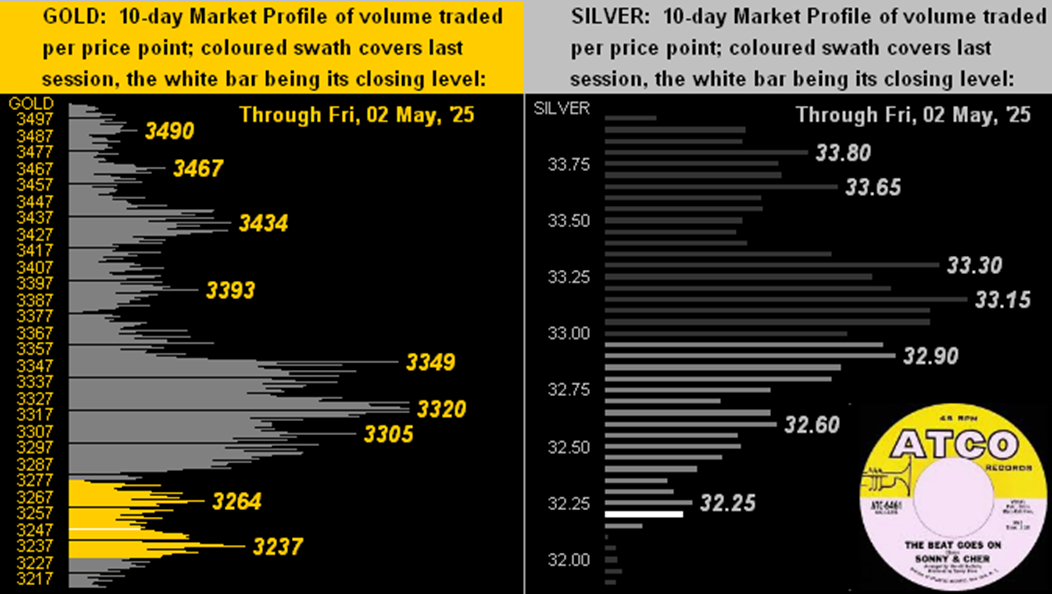
Further for the precious metals, here next are the 10-day Market Profliles for Gold on the left and Silver on the right. With present prices for the yellow and white metals all but at the bottom of their respective Profiles, both have taken a bit of a beat-down. Either way, as crooned the darling duo Sonny & Cher back in ’67, ![]() “The beat goes on…”
“The beat goes on…”![]() :
:
Although having turned lower near-term, the primary driving source for the on-balance rise in the precious metals — certainly century-to-date — and arguably (albeit erratically) so through the last three decades of the 20th century, is of course currency debasement, the eminent element therein being inflation. Simply stated for those of you scoring at home, the more there is of something (Dollars), the less each is worth, and thus the more that must be tendered in monetary transactions; (which for you WestPalmBeachers down there is why your Big Macs cost so much). As through the month of March, we’ve now all the data for our inflation summary as follows:
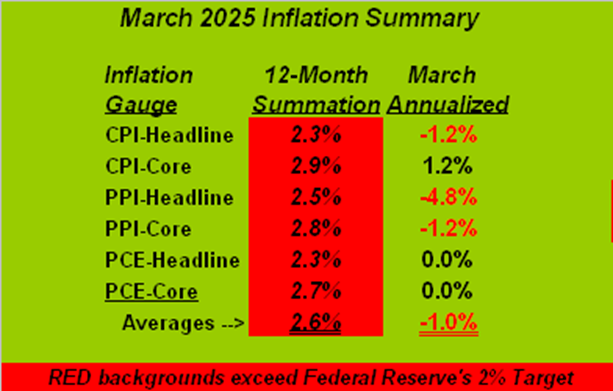
So you know where this is going given the Federal Reserve’s Open Market Committee issues their next Policy Statement come Wednesday (07 May). By the above summary’s 12-Month Summation column, every metric is above the Fed’s desired inflation pace of +2.0%. But annualizing March’s data alone — on average — is DEflationary! How reasonable is that for rate relief? After all, your cost of living went down in March, non?
“My usual stuff actually cost more, mmb…”
Oh say it ain’t so, Squire. But to his point, we are more frequently seeing the “S” word stagflation in the FinMedia mix. Thus is the economy retreating even as prices “in reality” are rising? Hat-tip the Atlanta Fed which predicted negative Q1 Gross Domestic Product, the initial reading for which came in at an annualized -0.3% — yet the chain deflator was a very inflative +3.7%! Stagflation indeed!
As for the Economic Barometer, of the 18 incoming metrics this past week, barely four improved period-over-period, including March’s Personal Spending, Pending Home Sales and Factory Orders. But at least the stock market went up, Bloomy referring to the rise as “Epic”; (obviously they need a semester in Market Mathematics). Here’s the Baro:
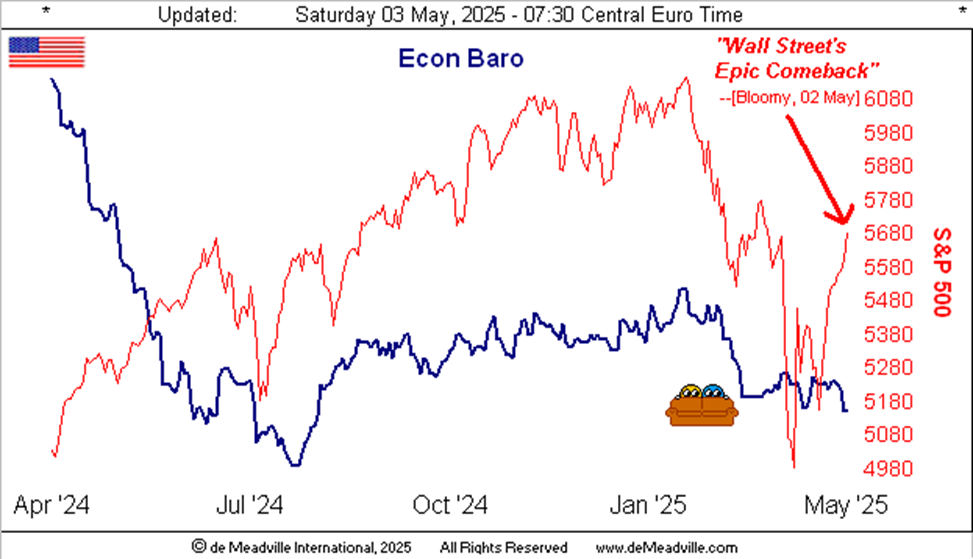
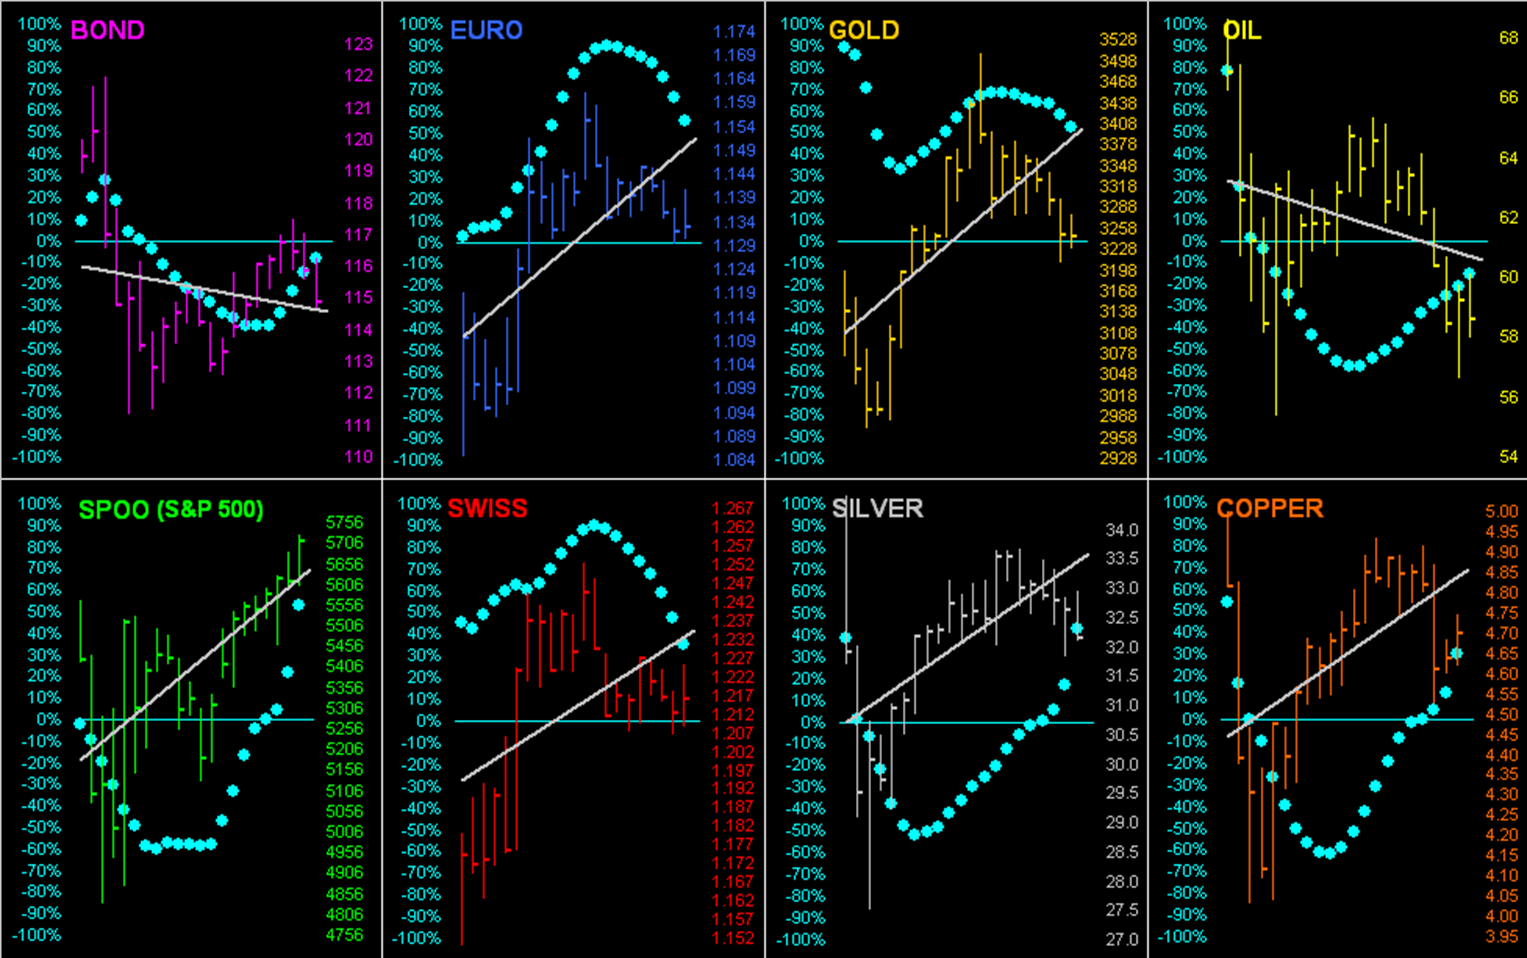
Regardless, ‘twould appear Wall Street sees inflation as having ceased, and per CNBC, “…stocks claw back tariff losses…” you see. Thus: let the Fed cut sans impunity, if you please! What do the BEGOS Markets see? Let’s go ’round the horn for all eight BEGOS components across their past 21 trading days (one month) with their respective grey trendlines and our famous “Baby Blues” of day-to-day regression trend consistency. And as the Dollar returns to getting a bit of a bid, note the blue dots rolling over to the downside for the Euro, Swiss Franc and Gold. All together now: ![]() “Follow the Blues instead of the news, else lose yer shoes”
“Follow the Blues instead of the news, else lose yer shoes”![]() :
:
And of course since our prior “month-end” missive (29 March), Gold has proceeded to blow through our forecast high for this year of 3262 en route to having reached 3510! Here by the monthly candles is Gold’s structural journey these past 16 years:
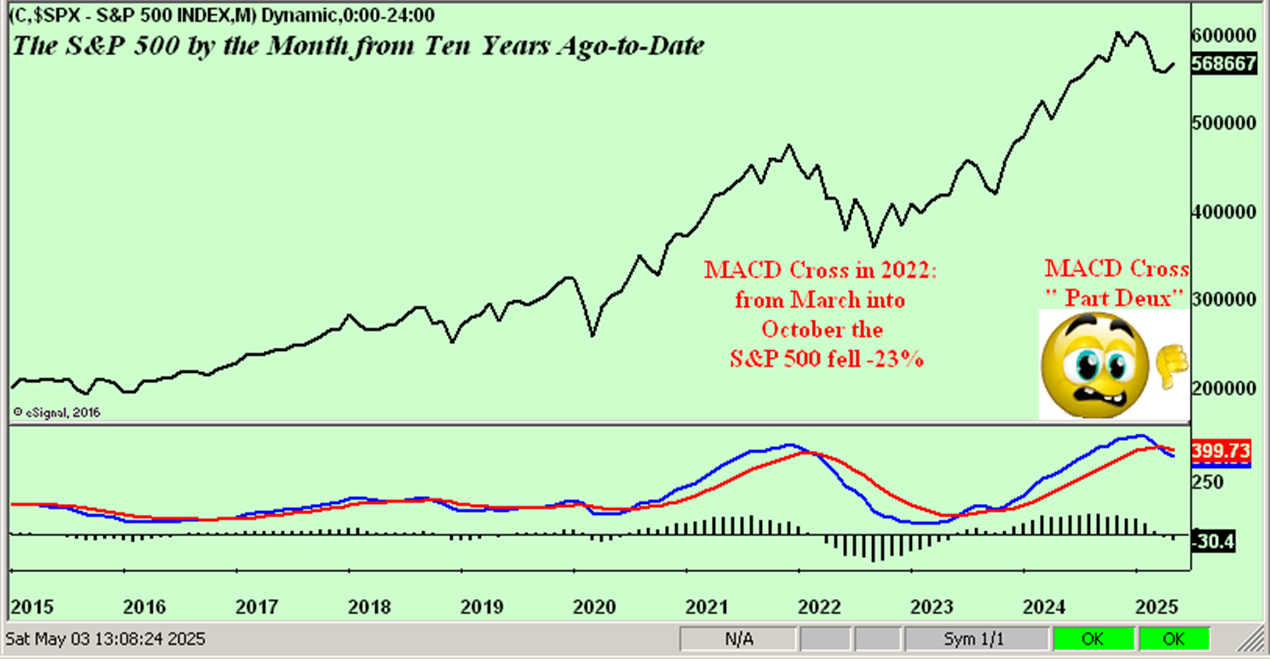
In closing, let’s review specific to the S&P 500 that which we anticipated back in our 05 April missive: a major negative crossover for the Index’s “moving average convergence divergence” (“MACD”). And ’twas just confirmed as the S&P closed out April. The last time the Index recorded such a high-level negative MACD crossover was at the conclusion of February in 2022, after which into October the S&P accumulated an all-in decline of -1,038 points (-23%). Ready?
“But mmb, in B-school they said stocks are a hedge against inflation, just like gold, eh?“
True enough, Squire. However, we were also taught (to yet again reprise Jerome B. Cohen): “…in bull markets the average [price/earnings] level would be about 15 to 18 times earnings…” Today, ridiculously beyond rationality, the “live” (i.e. trailing 12-months) p/e for the S&P settled the week yesterday at 43.9x(!) In other words: with stock prices unsupported by earnings, GDP shrinking, the economy showing signs of stagflation, and a liquid money supply that can only cover 44% of the “money” currently invested in the S&P 500, ’tis not the time to say to stocks “Buy-Buy!”, but rather “Bye-Bye!”
As for the slipping precious metals, think “Dip-Buy!”

Cheers!
…m…
www.TheGoldUpdate.com
www.deMeadville.com
and now on “X”: @deMeadvillePro
Read the full article here