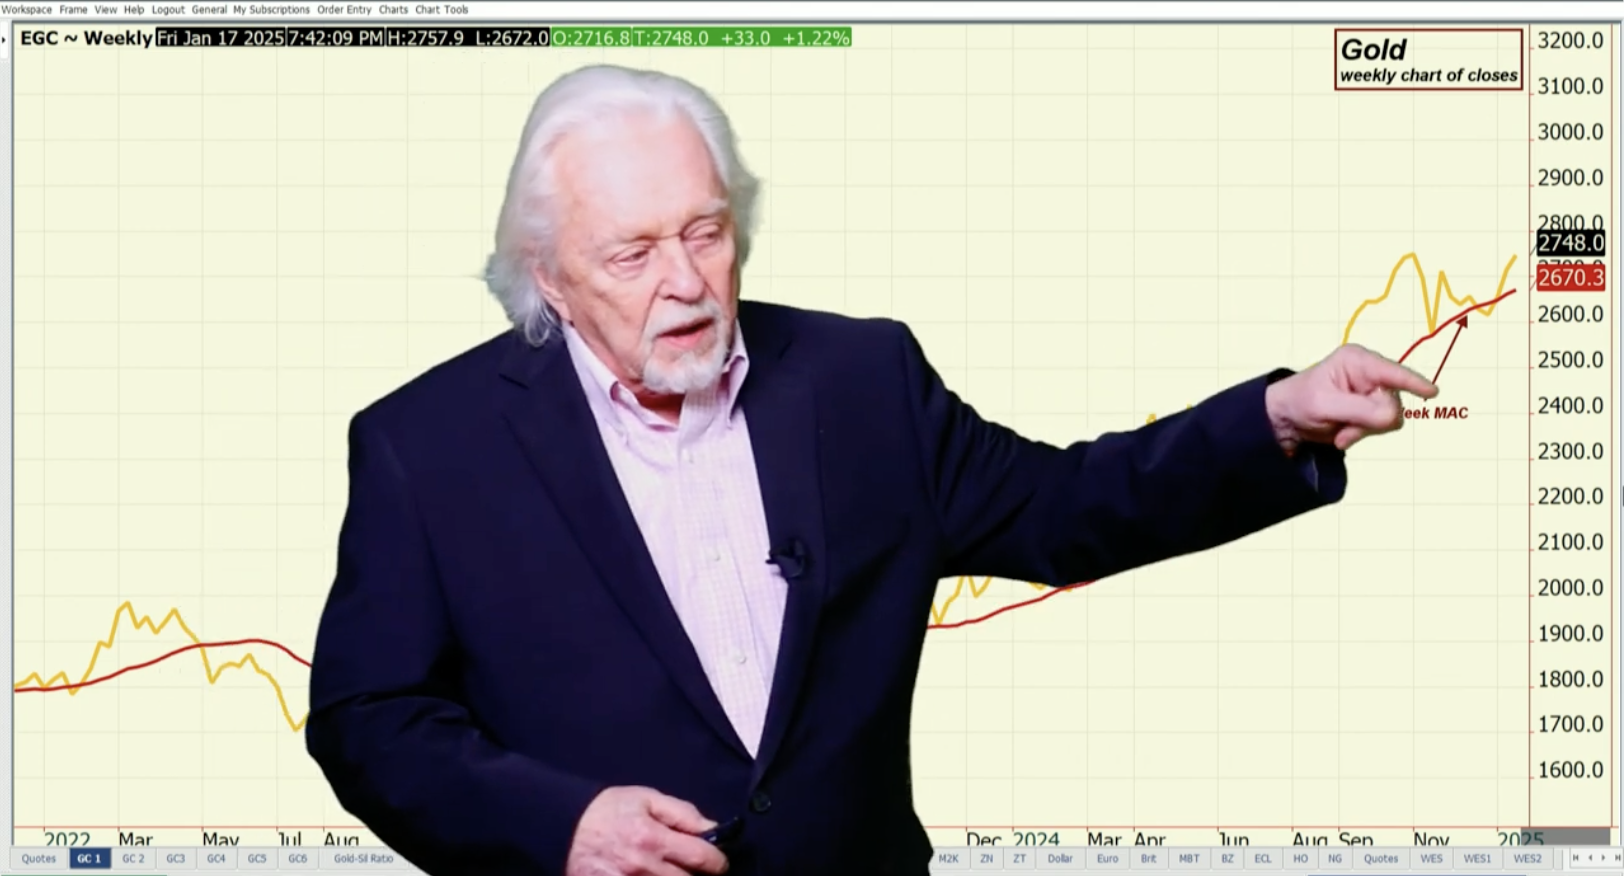
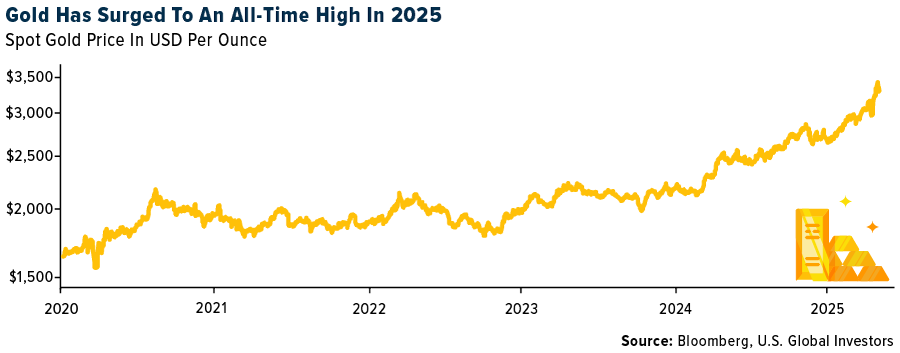
When we look at the gold market, you can see how the market’s been whipping around there, the 18-day average, and it moved back up. When we look at the gold itself, this is a new high for this move but you’re into an old resistance area here at the $2750 area – we’ll see if that means anything. The pattern is still very clear with higher lows, higher highs. The market is now seeing, and I want you to look at this, where you’re about to get a bullish crossover of the 18-day average going over the 100-day average, you’re right at the cusp of that.
The market is running the upper Bollinger Band right now. You’ve had three days of hitting it consistently, trying to push that band out as the market is an overbought territory. And as of yet, not even on the first day of trying to embed. You’re up nice and high, it is not a sell signal, but I wouldn’t be surprised if you see a bit of profit-taking at any point.
Read the full article here


Leave a Reply